What does the new extreme poverty data show?
New World Bank data leaves our understanding of the distribution of extreme poverty and projections largely unchanged, but confirms past global poverty targets were met and future targets remain challenging.
The global benchmark measure of extreme poverty has been revised to use more up-to-date comparisons of prices internationally. These purchasing power parities (PPPs) compare the cost of the same basket of goods and services in different countries to enable comparison between them (see our data blog before the release). They give an exchange rate between dollars and other countries’ currencies that allows people to buy the same basket.
The extreme poverty line has been updated to $1.90-a-day in 2011 PPPs, having been $1.25 in 2005 PPPs for many years. The 15 national poverty lines used to set the 2005 line were updated for inflation nationally, converted into dollars using the new 2011 PPPs then averaged, resulting in $1.90.
Comparing estimates on the two measures for 2011 shows relatively small changes to the overall extreme poverty level and its regional distribution.
Figure 1: People in extreme poverty by region in 2011 (millions, 2005 and 2011 PPPs)
The extreme poverty line seems to have been revised up while poverty levels have been revised down. But the increase is in US dollar terms. Different countries PPPs will have strengthened or weakened against the US prices.
The revision attempts to maintain the extreme poverty benchmark allowing for such movements: the $1.25-a-day line in 2005 PPPs and the $1.90-a-day line in 2011 PPPs are intended to represent the same poverty level. Effectively one dollar could generally buy less in local currencies in 2011 than in 2005, or local currencies could buy more. Where a country’s buying power rises relative to the US dollar, extreme poverty will fall, while extreme poverty will rise in countries where relative buying power has fallen.*
Data for most developing countries for the new measure can now be explored on PovcalNet, the World Bank’s online poverty tool.
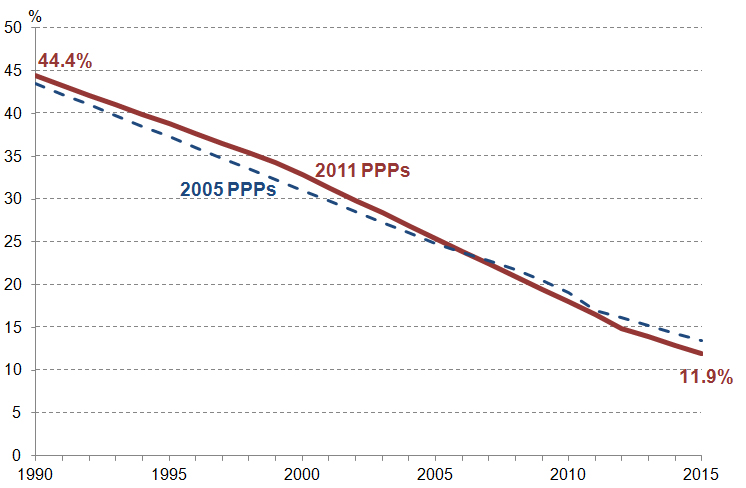
Forecasts suggest that the Millennium Development Goal target to halve global extreme poverty rates was achieved well ahead of the 2015 deadline. Using the new measure, 44% of people in developing countries were in extreme poverty in 1990; this is set to fall by almost three-quarters to 12% by 2015.
Figure 2: Percentage of people living in extreme poverty in developing countries, 1990–2015 (measured by 2005 and 2011 PPPs)
Despite an increasing global population, the actual numbers of people living in extreme poverty look set to fall from almost 2 billion in 1990 to just over 700 million in 2015 – an almost two-thirds reduction.
The Sustainable Development Goals (SDGs) include a target to end extreme poverty by 2030, currently measured as living on less than $1.25-a-day. The new $1.90-a-day measure seems likely to be included as the indicator for monitoring progress towards this target.
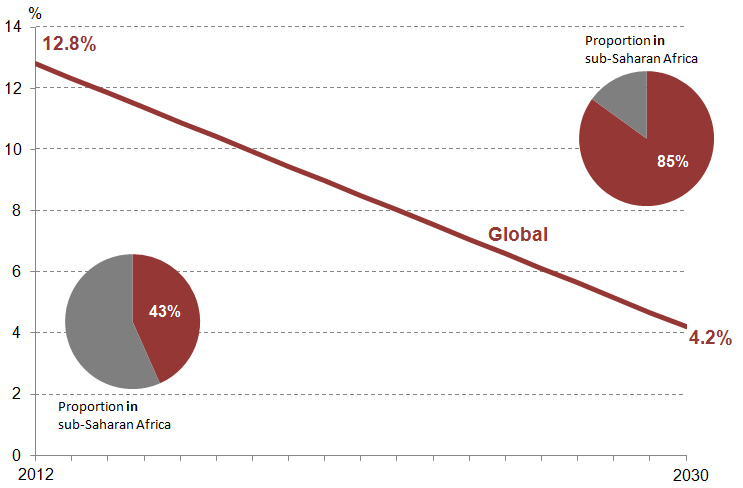
Available projections suggest that the general picture is broadly similar on either measure. The 2030 goal remains challenging, yet achievable, on the $1.90-a-day measure. As our Investments to End Poverty 2013 report showed, existing patterns of economic growth are unlikely to achieve this goal alone. This means targeted interventions will be required to help those people who otherwise would be at risk of being left behind.
Figure 3: Percentage of people projected to live in extreme poverty globally, 2012–2030 (using 2011 PPPs)
Extreme poverty looks set to become increasingly concentrated in sub-Saharan Africa. The region could account for over 85% of all those people in the world living in extreme poverty by 2030. These forecasts are based on countries’ historic growth rates. The International Monetary Fund (IMFs) recent revisions downwards of growth forecasts for sub-Saharan Africa could slow progress on extreme poverty in the region.**
The global extreme poverty measure only considers a single measure of income poverty. But the SDGs include a goal “to end poverty in all its forms everywhere”. The World Bank’s Chief Economist has appointed a Global Poverty Commission to consider how best to measure global poverty in future. This could involve monitoring a range of income thresholds, and broader measures of poverty and deprivation beyond income alone.
Download the data in Excel format.
Notes
* See also “The Richer Poverty Line”, Huffington Post, 13 Oct 2015
** In October 2015, the IMF forecast economic growth in sub-Saharan Africa of 3.8% in 2015 then 4.3% in 2016, down from 4.4% and 5.1% respectively forecast in July 2015 (from IMF, World Economic Outlook, Oct 2015, table 1.1 and World Economic Update, Jul 2015, table 1).
For detail on the World Bank’s approach to measuring extreme poverty, see Global Monitoring Report 2015, box 1.1 and PovcalNet, ‘What’s new’ page. For example, poverty estimates for a number of countries are yet to be revised to the 2011 PPP measure, and there are issues with data for the Middle East & North Africa region.
Source
All World Bank unless stated:
Figure 1: PovcalNet database (2011 PPP data) and 2005 PPP database
Figure 2: Global Monitoring Report 2015 (online data table, 2011 PPP) & 2014 (2005 PPP), intervening years interpolated
Figure 3: Ferreira et al, “A Global Count of the Extreme Poor in 2012”, World Bank policy research working paper 7432, Oct 2015, table 8 (1990, 1999, 2011, 2012), figure 9 (2030) with intervening years interpolated, and p37 (for sub-Saharan Africa share)
Related content
Priorities for the UK’s incoming Secretary of State Alok Sharma
As Alok Sharma takes office as Secretary of State, DI's Amy Dodd sets out key priorities for the UK and its global development agenda.
From review to delivery on the Global Goals – what should the immediate priorities be for the UK government?
On 26 June, the UK government published its Voluntary National Review measuring delivery against the Global Goals - but does it accurately capture progress?
Three priorities for the High-level Political Forum 2019
DI Director of Partnerships & Engagement Carolyn Culey sets out three key priorities for closing the gap between the poorest and the rest at HLPF 2019


