The not-so-simple world of deflators
If you need to do international comparisons of financial values over a number of years it makes sense to compare their actual spending power, which varies from year to year according to changing prices and exchange rates. Welcome to the world of deflators – economic metrics that exist to enable the comparison of data, taking out the impact of inflation and exchange rates. This slightly mysterious discipline exercises the minds of our analysts at Development Initiatives in the maintenance of our Development Data Hub, which contains an array of financial and socioeconomic data for all countries in the world.
In this age of globalisation you might assume that this is a very common issue so a standard approach to the problem would exist. But in reality this is not the case.
There are three main ways of getting the US$ deflators’ values: either by using the official list provided by the Organisation for Economic Co-operation and Development (OECD), or by simple calculations of the data provided by the World Bank and the International Monetary Fund (IMF). [1]
- Our analysts use a lot of data collected by the OECD, so this is their first port of call as they are keen to keep our calculations aligned with those of the original publisher. However, the OECD Development Assistance Committee (DAC) only keeps deflators for its 56 members and reporters (a list which changes from year to year).
- The IMF provides data on its 188 members.
- The World Bank provides data for deflators on its 189 members as well as Andorra, Cuba, Lichtenstein and Monaco (who are not members of either the IMF or the World Bank).
If the formula for calculating deflators is pretty straightforward and common, then these deflators from three different sources should align. So, in the spirit of the Joined-up Data Standards project, we’ve asked the question: can the three sources of deflators be used interchangeably for analytical purposes?
And the short answer is that no, they can’t.
Take the deflators for Saudi Arabia, for instance. Figure 1 shows the deflators from the different organisations based on 2015 current prices. As you can see, there are some significant differences:
IMF vs WB vs OECD deflators, 10 ys, SA
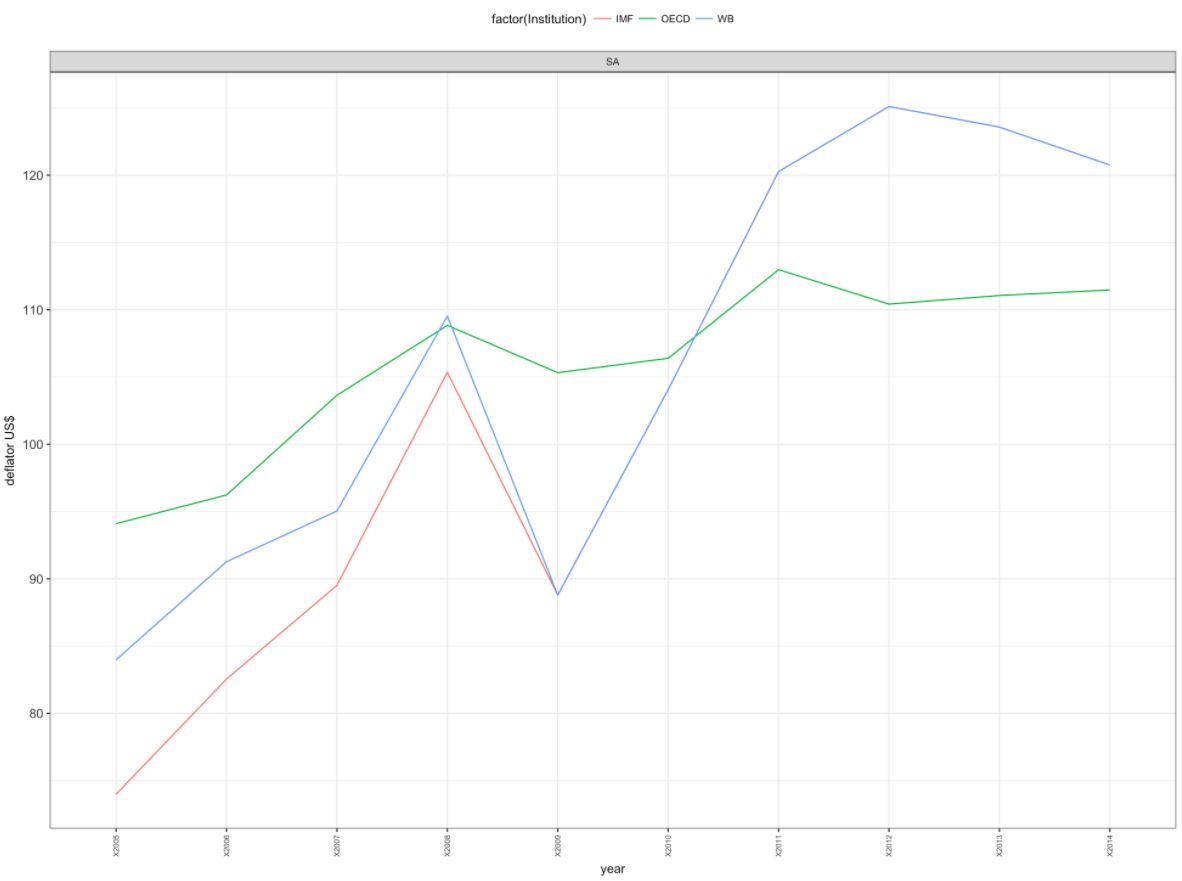
Figure 1: IMF, WB and OECD deflators for Saudi Arabia, 2005–2014. Source: IMF, OECD, and the World Bank
As the IMF and the World Bank cover the majority of the world, the next questions that springs to mind is: are there more examples where there are differences in the deflators they report (Figure 2)?
IMF vs WB vs OECD deflators, 10 ys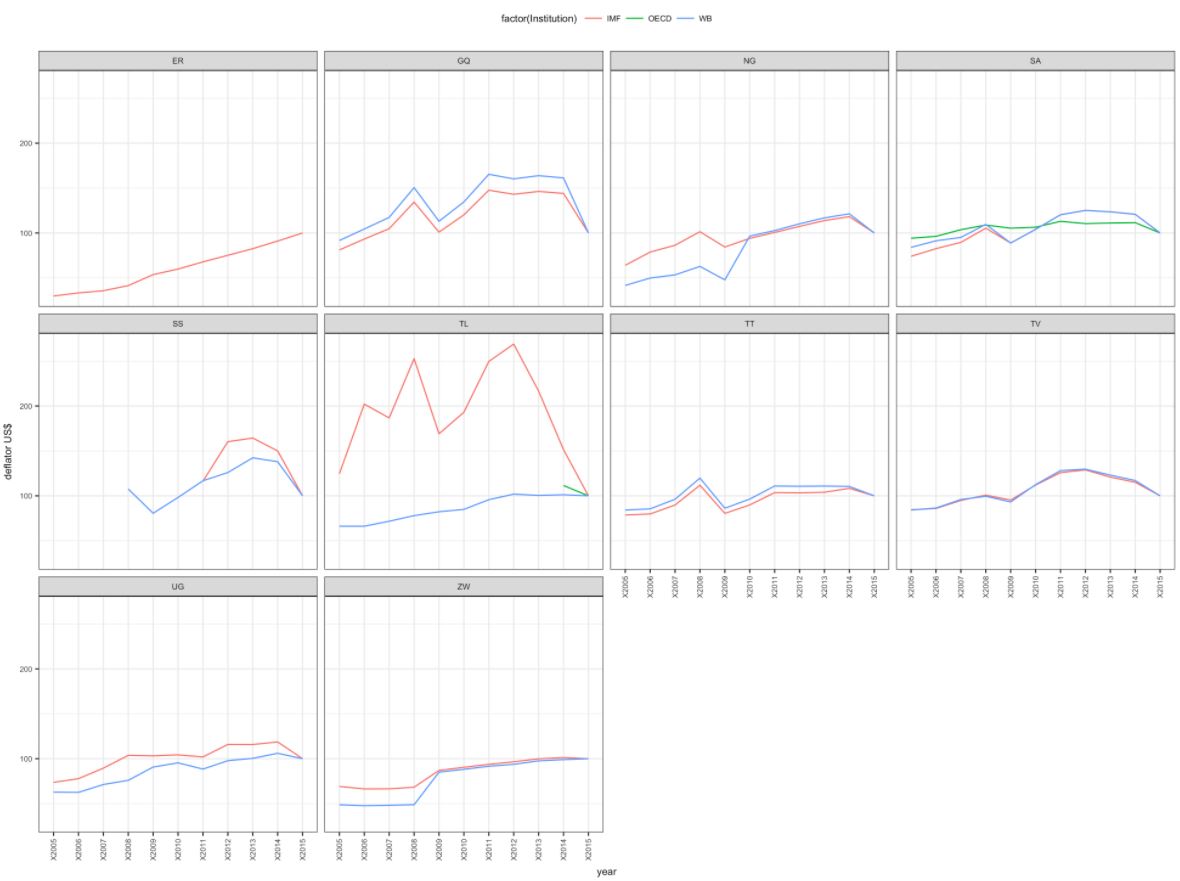
Figure 2: Deflators for 10 countries. ER: Eritrea; GQ: Equatorial Guinea; NG: Nigeria; SA: Saudi Arabia; SS: South Sudan; TL: Timor-Leste; TT: Trinidad and Tobago; TV: Tuvalu; UG: Uganda; ZW: Zimbabwe, as reported by the IMF, OECD and the World Bank. Deflators cover the period 2005–2015, with 2015 being the base year.
Timor-Leste (TL) and South Sudan (SS) are both examples of big discrepancies between the IMF and the World Bank. South Sudan gained its independence from Sudan in 2011 and this is reflected in the IMF deflators, which start at that year. The World Bank on the other hand assumes deflators before that time, which suggests that these deflators are estimated rather than measured. Timor-Leste is an extreme example of significant differences between the values reported by the IMF and the World Bank.
There are many users of data in the world who have a pressing and legitimate need to work with global financial data, but who are not experts on the scope and complexities of the different methodologies employed by global institutions. What are they to do?
At its best the problem of deflators is a nuisance, at worst it’s a prime example of the problems caused by organizations not joining up. Could these organizations work together and adopt a common standard for deflators?
The IMF and the World Bank, between them, cover deflators for the world. The OECD DAC only covers its members; a list that changes annually. A logical solution would be for the IMF and World Bank to work together on one database of deflators that could be used by all three organisations and the rest o the world.
All our blogs and papers describe complex cases where data standards talk about the same things but don’t speak the same language. This case is different though; here is a case where three international organisations are talking about the same thing (deflators), supposedly in the same language, so there should be no need for translation. To achieve a joined-up reliable analysis, we need joined-up deflators.
This blog was written as a part of the Joined-up Data Standards project, a joint initiative between Development Initiatives and Publish What You Fund.
Notes
[1] OECD publishes the list of deflators, whilst the IMF and the World Bank publish the crucial data used for the calculations of deflators. There is a standard way of calculating deflators, which is what DI analysts use to derive US$ deflators from the IMF and World Bank data. As logic follows: although the IMF and the World Bank do not publish publicly US$ deflators, they must calculate those for the purpose of their own analysis.


Related content
Priorities for the UK’s incoming Secretary of State Alok Sharma
As Alok Sharma takes office as Secretary of State, DI's Amy Dodd sets out key priorities for the UK and its global development agenda.
From review to delivery on the Global Goals – what should the immediate priorities be for the UK government?
On 26 June, the UK government published its Voluntary National Review measuring delivery against the Global Goals - but does it accurately capture progress?
Three priorities for the High-level Political Forum 2019
DI Director of Partnerships & Engagement Carolyn Culey sets out three key priorities for closing the gap between the poorest and the rest at HLPF 2019