
Poverty is complex and it can be described and measured in a variety of ways. In this factsheet we unpack some of the key terminology alongside the latest trends in poverty at the global, regional and national levels.
DownloadsThis factsheet (updated in February 2023) provides an overview of poverty trends at global, regional and national levels. It unpacks the terminology used to describe poverty and explains how it is measured. Measuring poverty is vital because it supports action to improve the lives of people currently living in poverty and those at risk of experiencing poverty in the future. It provides the information required to support better decision-making, influence policy outcomes and increase accountability.
► Read about the implications of the World Bank’s 2022 extreme poverty line update.
► Find out more about multidimensional poverty.
► Use our interactive charts to view trends in economic poverty.
People living in poverty are among the most vulnerable in society: as well as a lack of resources, the poorest families on average also experience higher infant mortality, higher stunting in children and lower educational attainment. To end poverty and improve the livelihoods of the poorest people, policymakers must be able to access accurate information regarding who is living in the greatest poverty, where and why.
The first Sustainable Development Goal (SDG 1: “End poverty in all its forms everywhere”) conveys the broad consensus in international development policy that poverty is multidimensional. It explicitly recognises that poverty can look different in different places. Ending poverty is only one of the SDGs. It complements 16 other SDGs that tackle a range of diverse needs, from educational outcomes to environmental sustainability, that must be met for people and communities to enjoy decent lives, and for places to progress.
Nevertheless, a multidimensional approach should not detract from recognising the centrality of money when understanding what poverty means for individuals and communities. When poverty is discussed as a social problem it is closely associated with economic constraints. This has formed the basis of a common international narrative that means, for example, that a person who has poor health or social outcomes but a high income, would not be considered to be living in poverty.
As a result, understanding levels, distributions and trends of economic poverty, as measured by the financial resources people have to meet their basic needs, is central to understanding people’s experiences and where poverty reduction efforts should be targeted.
Economic poverty can be defined by a fixed value (absolute poverty) or by a value in relation to the rest of the population (relative poverty). Absolute poverty is measured by a minimum amount of money required to meet basic needs, known as a poverty line. A person is considered to be living in poverty if their income, consumption or wealth falls below this line. In contrast, relative poverty is determined in relation to the economic status of other people: a person is living in poverty if their income, consumption or wealth is significantly below the average of the rest of the population. This places them in the proportion of the population living in the greatest poverty.
The international standard for measuring poverty is the extreme poverty line, a measure of absolute poverty with a threshold equivalent to $2.15 per person per day. Many have argued that the extreme poverty line is too low. Two more poverty lines are also used internationally: $3.65 and $6.85 per person per day. The World Bank describes the $2.15 line as “typical” of national poverty lines for low-income countries (LICs), while the $3.65 and the $6.85 lines are described as “typical” for LMICs and UMICs respectively. Countries also adopt their own national poverty lines to reflect what poverty looks like relative to average incomes in a country.
The extreme poverty line of $2.15 is standardised across countries using PPP currency conversions. PPP conversions reflect the real buying power of a currency, so that the value of the $2.15 line reflects the same local value of goods and services in different countries at different times.
International poverty is measured using data available from national household surveys, which capture population income and/or consumption data. The World Bank’s Poverty and Inequality Platform (PIP), a global repository for poverty data, contains data from over two million surveyed households, for 168 economies, for the period 1981–2021. Data from the PIP and national sources is used to generate international, regional and national poverty measures, and track poverty over time. However, there are data limitations due to factors including: household surveys often failing to capture data from vulnerable groups of people (including people not living in ‘households’, such as unhoused populations); the inability to disaggregate data within households; and the time delay (sometimes years) between collecting data and it being available for analysis.
There are many other complementary measures for poverty beyond income, which recognise the multidimensionality of poverty. Measures that document people’s health, education, the quality of their housing or their rights as citizens can be used alongside economic measures.
In 1990, it was estimated that 2.0 billion people were living below the extreme poverty line – 38% of the world population at the time. Poverty reduced during the Millennium Development Goals’ (MDGs) era (between 2000–2015 especially), demonstrating the power of concentrated global efforts; in fact, the goal (to reduce extreme poverty by half) was achieved in 2011, four years ahead of schedule.
In 2019 (the most recent year for which global estimates from the World Bank are available), 660 million people were living in extreme poverty – 8.5% of the world population. In 2020, that number increased and was estimated to be at 733 million; in 2022, it was estimated to have decreased to 682 million.



Global progress in the reduction of extreme poverty since 1990.

Chart showing global progress in the reduction of extreme poverty since 1990.
Source: Development Initiatives based on World Bank PIP, Mahler et al. 2022, UN World Population Prospects and IMF World Economic Outlook. Forecasts begin in 2020.
The number of people living on less than $3.65 a day increased between 1990 and 1999 (mostly attributable to rapid population growth in LICs and LMICs) but then fell between 1999 and 2019. However, it is estimated to have increased by about 160 million between 2019 and 2020. Estimates for 2022 suggest that 46 million more people were living on less than the $3.65 poverty line than in 2019. As of 2022, 23% of the global population (1.8 billion people) were living on less than this threshold.
Between 1990 and 2003, the number of people living on less than $6.85 a day increased, rising from 3.6 billion to a peak of almost 4.2 billion. From 2003, the number of people living below the $6.85-a-day line decreased until 2020 when the impact of Covid-19 pushed 179 million more people below that line. Poverty rates rebounded slightly in 2021 and 2022 but not fully. In 2022, there were still 124 million more people below the $6.85-per-day threshold than in 2019. In 2022, about two fifths of the world’s population (47%) lived on less than $6.85 a day.
Global trends in people living below the $3.65 poverty line: 1990–2022.
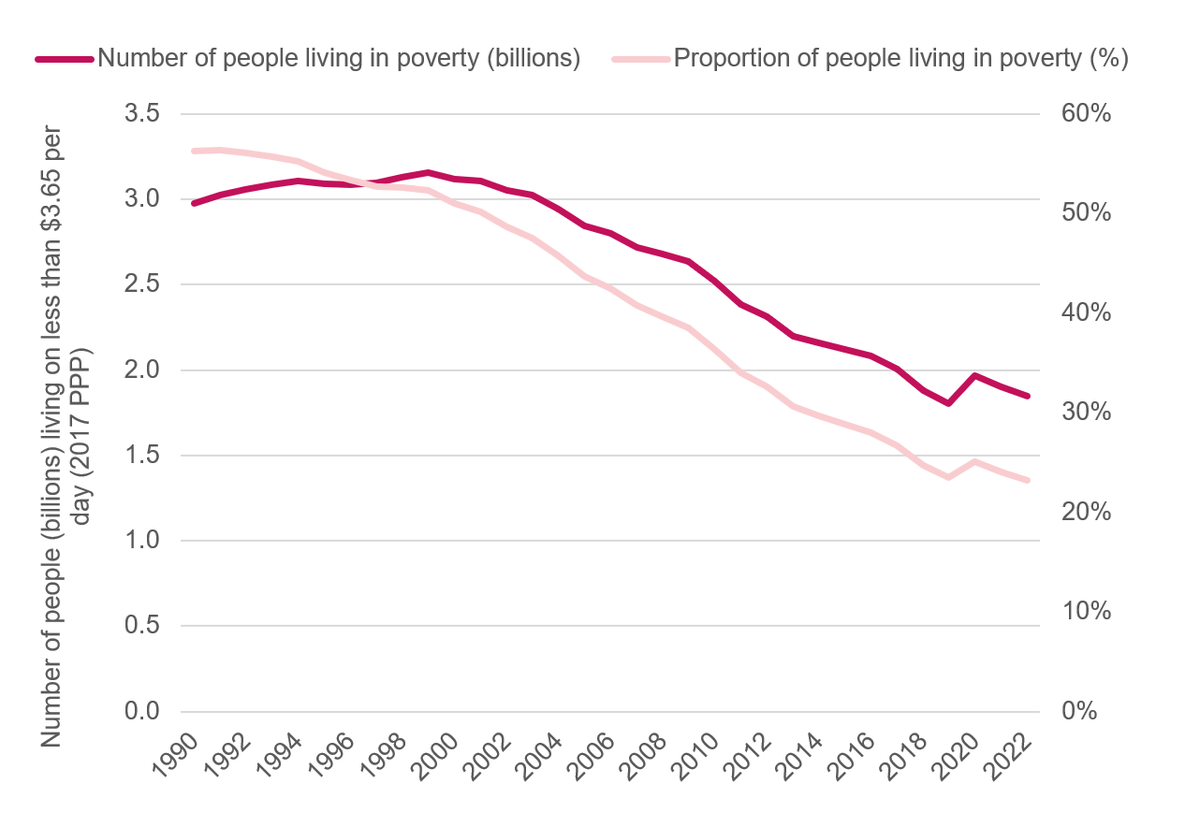
Chart showing global trends in people living below the $3.65 poverty line: 1990–2022.
Source: Development Initiatives based on World Bank PIP, Mahler et al. 2022, UN World Population Prospects and IMF World Economic Outlook. Forecasts begin in 2020.
Global trends in people living below the $6.85 poverty line: 1990–2022.
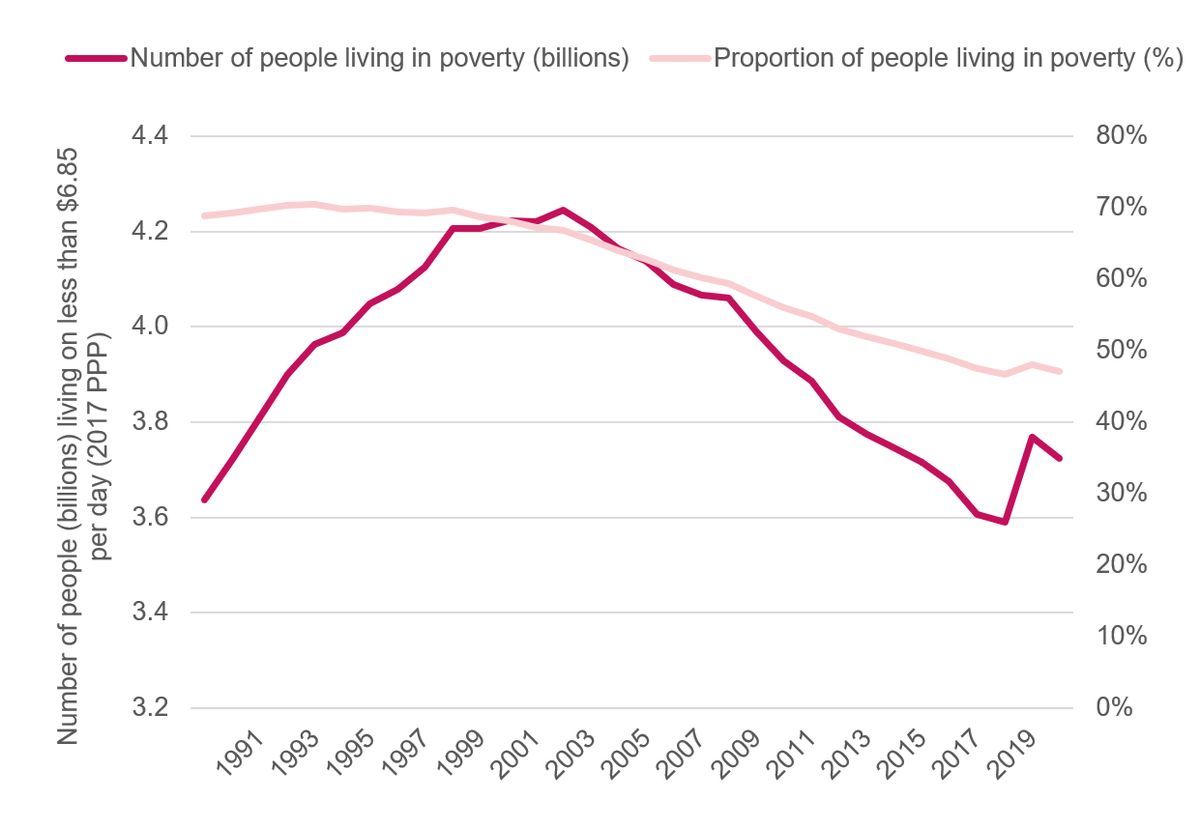
Chart showing trends in people living below the $6.85 poverty line: 1990–2022.
Source: Development Initiatives based on World Bank PIP, Mahler et al. 2022, UN World Population Prospects and IMF World Economic Outlook. Forecasts begin in 2020.
While at a global level extreme poverty declined between 1990 and 2019, this trend did not occur everywhere. Both the proportion and number of people living in extreme poverty (below the $2.15 threshold) has decreased in most regions of the world since 1990. However, there are stark regional differences in the rates of change that alter the global distribution of where the most people are living in poverty.
The proportion of people living in extreme poverty by region: 2002–2022.

Chart showing the proportion of people living in extreme poverty by region: 2002–2022.
Source: Development Initiatives based on World Bank PIP, Mahler et al. 2022, UN World Population Prospects and IMF World Economic Outlook. Forecasts begin in 2020.
Since 1990, there has been a significant reduction in the number of people living in extreme poverty in the regions of East Asia and Pacific, Latin America and the Caribbean, and South Asia. East Asia and the Pacific has experienced the greatest change: in 1990, the region was home to 53% of the world’s people living in extreme poverty (over 1 billion people), but by 2022 this had dropped to 4% (29 million people). This rate of poverty reduction is unmatched anywhere else in the world, with the extreme poverty rate within East Asia dropping from 65% to 1% in this period. This poverty reduction was accompanied by high levels of human capital growth, due to advances in health and education, and high levels of GDP growth.
The proportion of the population living in extreme poverty in Sub-Saharan Africa fell over the past three decades from 53% in 1990 to 35% in 2022. However, this represents the slowest decline among world regions. Africa’s population has grown at a faster rate than any other region since 1992, contributing to the number of people living in poverty increasing from 275 million in 1990 to 426 million in 2022. As a result, over 62% of the global population experiencing extreme poverty (living on less than $2.15 a day) live in Sub-Saharan Africa.
Just as global trends of the proportion of people living in extreme poverty mask regional differences, regional trends in extreme poverty mask differences in progress made at the national level. Although most countries worldwide have seen a decrease in the number of people living in extreme poverty since 1990, in 37 countries levels of extreme poverty have remained constant or increased.
Our interactive charts provide a detailed representation of global, regional and national trends in economic poverty in recent decades.
National trends in the proportion of people living in extreme poverty: 1990–2022.
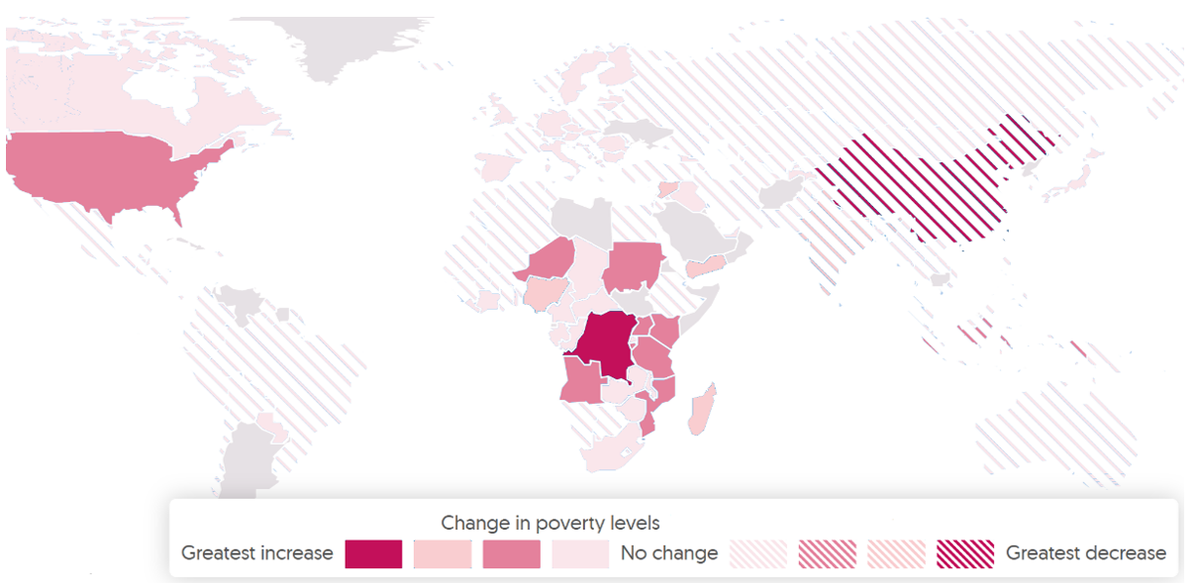
Global map showing national trends in the proportion of people living in extreme poverty: 1990–2022.
Source: Development Initiatives based on World Bank PIP, IMF World Economic Outlook, Mahler et al. 2022, and UN World Population Prospects.
Note: The boundaries and names used for countries and regions do not imply official endorsement or acceptance by Development Initiatives Poverty Research Ltd.
Rapid economic growth in economies with the largest populations has been a key factor in global poverty reduction. In 1990, China and India were home to just under 1.2 billion people living in extreme poverty – over 61% of the people experiencing extreme poverty in the world at that time. By 2022, it was estimated that less than 117 million people in the two countries were living in extreme poverty: a huge reduction. However, while China essentially eliminated extreme poverty in 2017 (with rates at 0.1%), about 8.2% of India’s population remained below the extreme poverty line in 2022.
While more than half of the 44 countries in Sub-Saharan Africa with available poverty-trend data have experienced a reduction in people living in extreme poverty since 1990, 18 have experienced an increase. Guinea lifted 74% of its population from extreme poverty between 1990 and 2022, while other countries in the region confronted factors that make poverty reduction difficult, such as conflict and political instability. In Zimbabwe, for example, the headcount of people living in extreme poverty increased by 29% between 1990 and 2022.
Rises in the numbers of people experiencing extreme poverty were most acute in the DRC, Madagascar, Yemen and Nigeria (although the proportion of the DRC and Nigeria’s populations living below the extreme poverty line reduced during the same period). Population growth and the unequal distribution of economic gains have led to a steady rise in the number of people living in poverty in many economies in Africa, despite general economic expansion.
Using our model, which assumes that shocks to GDP were equally distributed since the last household survey was conducted, we estimate that Nigeria has 7.5 million more people living in extreme poverty in 2022 than in 2019, followed by the Philippines with an increase of 6.4 million more people living in extreme poverty, and the DRC with 6.0 million additional people experiencing poverty.
Economic poverty (defined by the extreme poverty line) represents a global measure for assessing individual needs. Ending extreme poverty by 2030 is a principal target of the SDGs and significant progress has been made in reducing economic poverty globally since 1990. However, current measures of global poverty are incomplete in several important ways, for example: data is measured at a household level, masking differences in poverty within households; some countries have no data in the PIP at all (such as Afghanistan, Libya and the Democratic People’s Republic of Korea (DPRK)); and poverty measured by a threshold line does not consider the living standards of the people living in the greatest poverty (those with the lowest expenditure or income).
Additionally, using surveys to create a global summary for all countries presents considerable challenges. Countries’ circumstances, consumption patterns, and economic patterns can significantly vary. For many countries, surveys are infrequent, national statistical offices are under-resourced, and estimating PPP remains challenging – especially in 2022 and 2023 when inflation and prices have been particularly volatile.
The data used in this factsheet (the most recent globally comparable poverty data) is incomplete and is not updated frequently (the most recent update was for 2019). This means that essential poverty data remains out of date as we enter the decade of delivery for the SDGs. Timeliness of data must improve if we are serious about monitoring the progress of the SDGs.
Economic poverty is just one measure of the needs of the people living in the greatest poverty: poverty can also be social, nutritional, cultural or multidimensional. The global definition of extreme poverty does not directly measure these other factors.
The first goal of the SDGs – ending poverty in all its forms everywhere – requires a better understanding and reporting of economic, social, nutritional and cultural needs and resources at an individual level. Poverty can only be comprehensively assessed with metrics that expand its scope beyond purely economic terms. Measures such as the Multidimensional Poverty Index, the P20 approach, food poverty, inequality indices and fragility and vulnerability measures are all indispensable tools in attempts to end poverty.
Two interactive charts let you explore global, regional and national trends in the number and proportion of people living in poverty between 1990 and 2022.
In 2022, the World Bank updated the extreme poverty line; Zach Christensen makes sense of what this means for understanding how people experience poverty.
This briefing clarifies the concept of multidimensional poverty, highlighting the value of a person-centred and context-specific understanding of poverty.