
Use our interactive chart to reveal vulnerability to the impacts of climate change, volumes of climate finance (ODA) by country, and how specific risk and geographic groups fare.
The accelerating impacts of climate change affect people worldwide, with those already experiencing humanitarian crises often more severely impacted. Changes in the climate and extreme weather events result in food insecurity, livelihood disruptions and economic setbacks. With large gaps in both humanitarian and climate finance, it is imperative that the right assistance reaches the people and places who need it most.
Our interactive chart maps the volumes of climate finance (showing specifically official development assistance) against levels of vulnerability to the impacts of climate change around the world. Ahead of COP 29, we provide the latest data, with a specific focus on climate official development assistance (ODA) to fragile and conflict-affected states, which have limited ability to prepare and respond to climate change impacts.
With this data tool you can explore:
In addition, there are interactive bubble charts highlighting regional trends in:
Transparent and accessible data helps highlight gaps and opportunities to those advocating for a more comprehensive response to climate change. For more on climate finance data, tracking, accountability and the triple nexus, check out some of the related links at the bottom of the page.
Help others use this resource: share on X (formerly Twitter) or via LinkedIn, or email your comments and questions to [email protected].



The controls above the map allow you to view the different dimensions of data – you can see climate ODA as total volumes (in US dollars), or as a percentage of all ODA received by a country. You can choose to see all data, or specifically adaptation or mitigation ODA. Volumes (US dollars) and ODA are indicated by the colour scale. You can also choose to see data for different years and for different levels of vulnerability to the impacts of climate change, as well as countries in protracted crisis.
Hovering over a country provides additional detail.
You can zoom in and out of the map, and return to the default view using the ‘Reset’ button below the map.
To view this interactive visualisation make sure JavaScript is available on your device.
To view this interactive visualisation use a device with a larger screen.
Source: Development Initiatives based on ODA disbursements reported to OECD DAC Creditor Reporting System. Data for vulnerability scores from Notre Dame Global Adaptation initiative (NG-GAIN), and UN Multidimensional Vulnerability Index ranked from ‘Very low’ to ‘Very high’. Data on crisis state gathered from the UN Office for the Coordination of Humanitarian Affairs (OCHA).
Note: Protracted Crisis countries are defined as undergoing five or more consecutive years of UN-coordinated appeals. Dual purpose funding is included in total climate finance, however is not specified in finance type breakdown. This map does not imply expression by DI concerning the legal status or reality of borders or territories. See the ‘Key Definitions’ section (at the bottom of the page) for more information.
The countries’ climate vulnerability scores are determined using data sourced from the Notre Dame Global Adaptation Initiative (ND-GAIN) vulnerability index and the UN Multidimensional Vulnerability Index.
These scores include a range of measures of a country’s susceptibility to climate change and natural disasters, as well as their preparedness to respond. From these, we derive an index that operates on a scale from 0 to 100. Countries are categorised into five vulnerability levels: very low (less than 40), low (40–50), medium (50–55), high (55–60), and very high (over 60).
Climate finance comes from both the public and private sectors, including as bilateral and multilateral official development assistance (ODA). It is distributed in the form of grants and loans. In 2009, developed nations pledged to provide a yearly sum of US$100 billion in climate finance to support low- and middle-income countries, a commitment that remains unfulfilled. In 2022, country-allocable climate ODA was, on average, 6.2% of ODA for countries not in protracted crisis. In countries experiencing protracted crises, the average proportion was 6.0%.
Figure 2 uses scaled bubbles to show the amount of total climate finance for each country. Countries to the left-hand side of the chart are less vulnerable to the impacts of climate change, while countries on the right hand side are more vulnerable. Protracted crisis countries are shaded dark pink.
Climate ODA to all countries, 2022
Hovering over a country provides additional detail. Clicking on the legend allows you to remove or add country groupings.
To view this interactive visualisation make sure JavaScript is available on your device.
To view this interactive visualisation use a device with a larger screen.
Source: Development Initiatives based on ODA disbursements reported to OECD DAC Creditor Reporting System, Notre Dame Global Adaptation initiative (NG-GAIN), UN Multidimensional Vulnerability Index.
Notes: Protracted Crisis countries are defined as undergoing five or more consecutive years of UN-coordinated appeals. Data published for 2022 in US$ millions. European ODA eligible countries excluded from the figure. Bubbles scaled by total finance received in US$ millions by each country. See the ‘Key Definitions’ section (at the bottom of the page) for more information.
Assessing climate ODA as a proportion of total ODA presents a different picture, and hints at a potential connection between funding volumes, vulnerability levels and precise targeting. If a country with high vulnerability to climate change receives a larger share of ODA as climate finance, this could indicate that funding is better aligned with need.
Figure 3 uses scaled bubbles to show climate ODA as a share of total ODA for each country. Countries to the left-hand side of the chart are less vulnerable to the impacts of climate change, while countries on the right-hand side are more vulnerable. Protracted crisis countries are shaded dark pink.
Climate ODA as a share of total ODA, 2022
Hovering over a country provides additional detail. Clicking on the legend allows you to remove or add country groupings.
To view this interactive visualisation make sure JavaScript is available on your device.
To view this interactive visualisation use a device with a larger screen.
Source: Development Initiatives based on ODA disbursements reported to OECD DAC Creditor Reporting System, Notre Dame Global Adaptation initiative (NG-GAIN), UN Multidimensional Vulnerability Index.
Notes: Protracted Crisis countries are defined as undergoing five or more consecutive years of UN-coordinated appeals. European ODA eligible countries excluded from the figure. Bubbles scaled to share of ODA received as climate finance. See the ‘Key Definitions’ section (at the bottom of the page) for more information.
Calculating the volume of climate finance received as a ‘per capita’ figure provides an additional perspective for assessing the sufficiency of climate finance to a country.
Over the last two decades, the amount of climate finance allocated per person exhibits significant disparities (particularly between countries that are and are not experiencing protracted crisis). In 2022, the average climate ODA per person globally was US$21.32. In ODA-eligible countries not facing protracted crises this average climate ODA rose to US$29.28 per person. In contrast, countries that are experiencing protracted crises received only US$3.05 per person.
Figure 4 uses scaled bubbles to show the amount of per-person climate ODA for each country. Countries to the left-hand side of the chart are less vulnerable to the impacts of climate change, while countries on the right-hand side are more vulnerable. Protracted crisis countries are shaded dark pink.
Climate ODA per person, 2022
Hovering over a country provides additional detail. Clicking on the legend allows you to remove or add country groupings.
To view this interactive visualisation make sure JavaScript is available on your device.
To view this interactive visualisation use a device with a larger screen.
Source: Development Initiatives based on ODA disbursements reported to OECD DAC Creditor Reporting System, Notre Dame Global Adaptation initiative (NG-GAIN), UN Multidimensional Vulnerability Index.
Notes: Protracted crisis countries are defined as undergoing five or more consecutive years of UN-coordinated appeals. European ODA eligible countries excluded from the figure. Bubbles scaled to US$ of climate funding per citizen. See the ‘Key Definitions’ section (at the bottom of the page) for more information.
Adaptation ODA plays a pivotal role in limiting the effects of climate-induced disasters by equipping communities with the resources needed to withstand these shocks. This encompasses a range of strategies, including ecosystem-based adaptations, innovative financing mechanisms and investments in resilience-building. Mitigation ODA focuses specifically on emissions reductions.
While the UNFCCC recognises the equal importance of adaptation and mitigation efforts, the funding disparity in 2022 was stark, with US$9.0 billion allocated for mitigation and only US$1.8 billion for adaptation.
A share of adaptation ODA greater than the global average may suggest its prioritisation. However, it is important to note that current adaptation finance is estimated to fall at least 5–10 times short of what is needed to prepare low-income countries for accelerating climate impacts. It is also crucial to scrutinise the capacity of specific projects funded by this climate finance to effectively address need.
Figure 5 uses scaled bubbles to show the amount of adaptation ODA for each country. Countries to the left-hand side of the chart are less vulnerable to the impacts of climate change, while countries on the right-hand side are more vulnerable. Protracted crisis countries are shaded dark pink.
Adaptation ODA as a share of ODA, 2022
Hovering over a country provides additional detail. Clicking on the legend allows you to remove or add country groupings.
To view this interactive visualisation make sure JavaScript is available on your device.
To view this interactive visualisation use a device with a larger screen.
Notes: Development Initiatives based on ODA disbursements reported to OECD DAC Creditor Reporting System, Notre Dame Global Adaptation initiative (NG-GAIN), UN Multidimensional Vulnerability Index.
Source: Protracted Crisis countries are defined as undergoing five or more consecutive years of UN-coordinated appeals. European ODA eligible countries excluded from the figure. Bubbles scaled to the sum of adaptation finance as a share of total ODA received. See the ‘Key Definitions’ section (at the bottom of the page) for more information.
Adaptation and mitigation finance are equally vital components to tackling the climate crisis. Finance targets should be aligned with nationally determined priorities for both mitigation and adaptation. While longer term benefits are possible with mitigation projects (such as energy transitions), adaptation projects to alleviate impacts from both sudden- and slow-onset events (like droughts, flooding or sea-level rise) are critical to preserving development gains. In general, most countries receive more mitigation than adaptation.
Figure 6 shows the portion of total climate ODA represented by mitigation, dual purpose (both mitigation and adaptation) and adaptation ODA to the countries experiencing protracted crisis. These are ordered with those countries most vulnerable to climate change impacts at the top.
Adaptation and mitigation ODA in protracted crisis countries, 2022
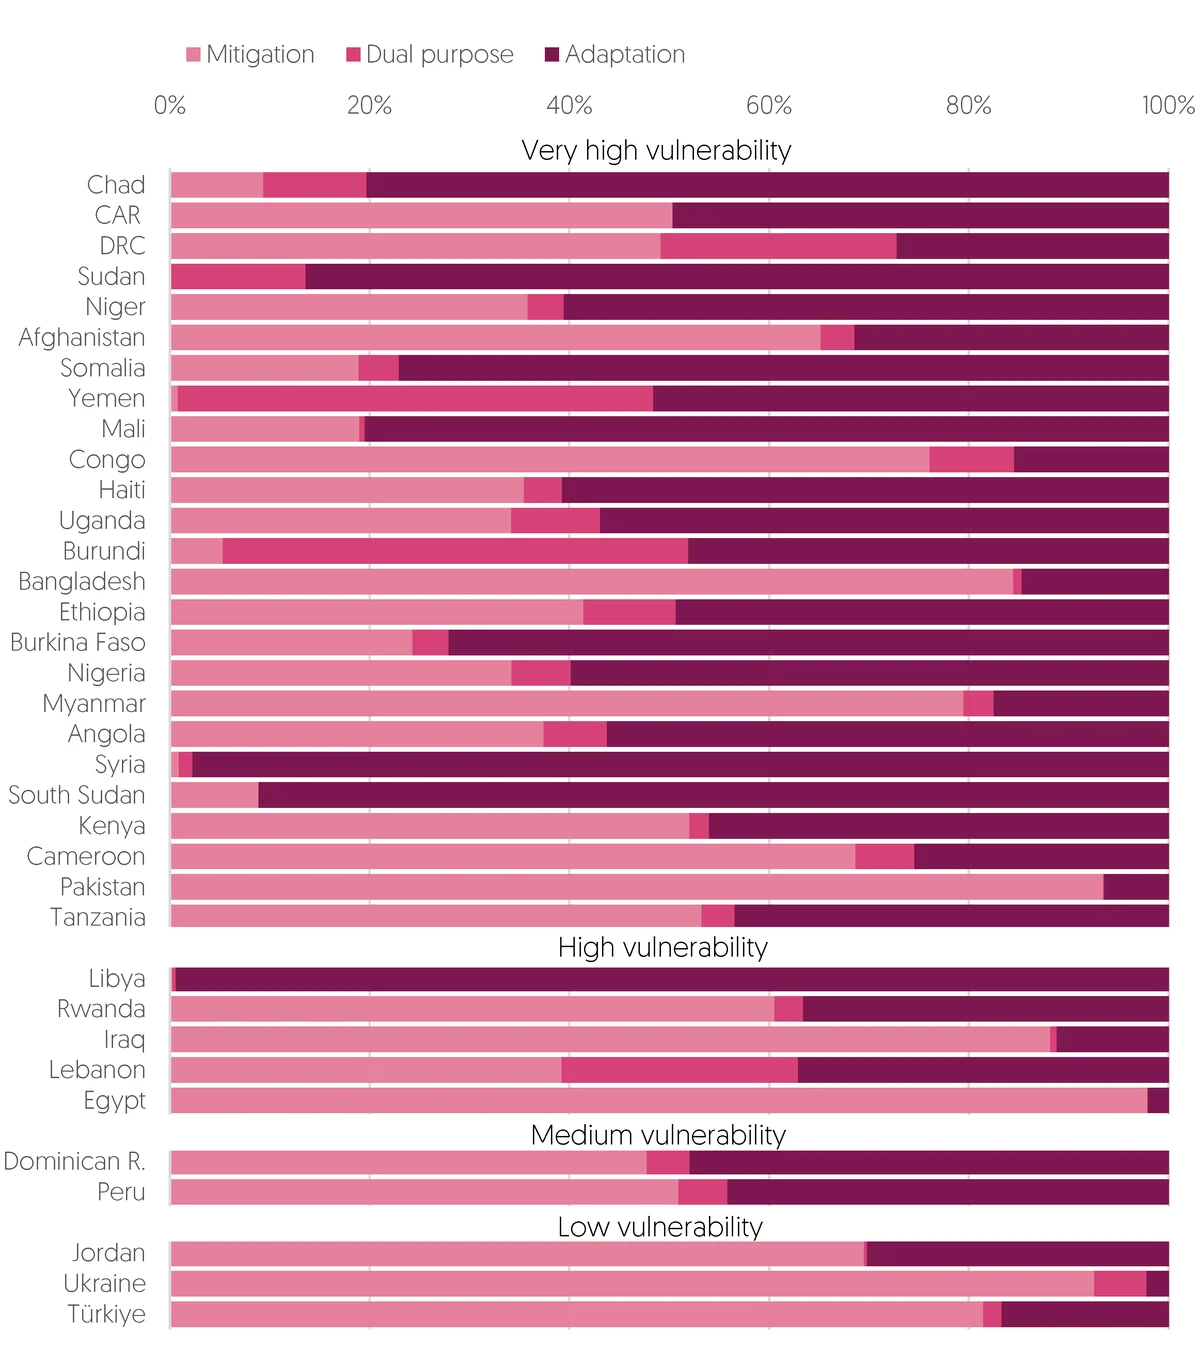
| country | Mitigation | Dual purpose | Adaptation | vulnerability |
|---|---|---|---|---|
| Libya | 100% | 0% | 0% | High vulnerability |
| Panama | 99% | 0% | 1% | Medium vulnerability |
| Costa Rica | 98% | 1% | 1% | Low vulnerability |
| Colombia | 96% | 4% | 0% | Medium vulnerability |
| Congo | 94% | 0% | 6% | Very high vulnerability |
| Mexico | 94% | 0% | 6% | Medium vulnerability |
| Türkiye | 94% | 2% | 4% | Low vulnerability |
| Bangladesh | 93% | 0% | 7% | Very high vulnerability |
| Ukraine | 93% | 3% | 3% | Low vulnerability |
| Brazil | 90% | 2% | 8% | Medium vulnerability |
| Nigeria | 89% | 4% | 7% | Very high vulnerability |
| Ecuador | 87% | 3% | 10% | High vulnerability |
| Peru | 86% | 4% | 10% | Medium vulnerability |
| Cameroon | 80% | 6% | 14% | Very high vulnerability |
| Egypt | 78% | 1% | 21% | Medium vulnerability |
| Zambia | 66% | 23% | 11% | High vulnerability |
| Pakistan | 65% | 0% | 35% | High vulnerability |
| Tanzania | 61% | 4% | 34% | High vulnerability |
| DRC | 52% | 29% | 19% | Very high vulnerability |
| Lebanon | 51% | 9% | 40% | High vulnerability |
| Myanmar | 51% | 3% | 46% | Very high vulnerability |
| Iraq | 47% | 1% | 52% | High vulnerability |
| Burkina Faso | 40% | 10% | 50% | Very high vulnerability |
| Burundi | 38% | 37% | 25% | Very high vulnerability |
| Kenya | 37% | 12% | 51% | High vulnerability |
| Uganda | 32% | 14% | 54% | Very high vulnerability |
| Ethiopia | 29% | 5% | 65% | Very high vulnerability |
| Haiti | 28% | 7% | 65% | Very high vulnerability |
| Jordan | 25% | 52% | 23% | Low vulnerability |
| Venezuela | 21% | 5% | 74% | High vulnerability |
| Afghanistan | 14% | 22% | 63% | Very high vulnerability |
| Rwanda | 12% | 0% | 87% | High vulnerability |
| Dominican Republic | 11% | 5% | 84% | Medium vulnerability |
| Niger | 10% | 4% | 86% | Very high vulnerability |
| Sudan | 4% | 3% | 93% | Very high vulnerability |
| Somalia | 3% | 40% | 58% | Very high vulnerability |
| Mali | 2% | 2% | 96% | Very high vulnerability |
| Angola | 1% | 16% | 83% | Very high vulnerability |
| Syria | 1% | 15% | 84% | Very high vulnerability |
| CAR | 0% | 6% | 94% | Very high vulnerability |
| Chad | 0% | 12% | 88% | Very high vulnerability |
| Yemen | 0% | 41% | 59% | Very high vulnerability |
Source: Development Initiatives based on ODA disbursements reported to OECD DAC Creditor Reporting System, Notre Dame Global Adaptation initiative (NG-GAIN), UN Multidimensional Vulnerability Index.
Notes: Protracted crisis countries are defined as undergoing five or more consecutive years of UN-coordinated appeals. Includes 44 protracted crises defined in 2022. The three funding types sum to total climate finance. See key definitions for more information.
Climate change is producing more frequent and more intense periods of drought, forest fires and flooding, all of which have a direct impact on harvests and food cultivation. Globally, the number of people experiencing food insecurity is growing. About 80% of those experiencing food insecurity are experiencing protracted crises. Adaptation finance is a critical part of building resilience to food insecurity, funding changes in agriculture and preparing communities for climate impacts like droughts and floods.
Food insecurity is experienced by people who cannot afford or access essential food needs. This can result in malnutrition, starvation or death. However, knowing the total number of people who are facing food insecurity in a particular region or country does not show a full picture. The intensity of food insecurity can differ from crisis-level (IPC Phase 3) to catastrophic or famine level (IPC Phase 5). The difference between the number of people at each IPC phase can be understood as a gap: populations with a wider gap are those experiencing more intense food insecurity and who require more urgent interventions.
To measure these differences, DI created a metric called the ‘food insecurity gap’. This is a single percentage figure which considers the number of people at each level of food insecurity in a country. For more information on how this is calculated, see Key Definitions below. Higher percentages are read as wider gaps. The full methodology can be found in our factsheet The food insecurity gap and protracted humanitarian crisis.
Figure 7 uses scaled bubbles to show the amount of adaptation ODA for each country with a food insecurity gap in 2022. Countries to the left-hand side of the chart are less vulnerable to the impacts of climate change, while countries on the right-hand side are more vulnerable. Countries higher up the chart have a more severe food insecurity gap. Protracted crisis countries are shaded dark pink.
Food insecurity gap and adaptation ODA, 2022
Hovering over a country provides additional detail. Clicking on the legend allows you to remove or add country groupings.
To view this interactive visualisation make sure JavaScript is available on your device.
To view this interactive visualisation use a device with a larger screen.
Source: Development Initiatives based on ODA disbursements reported to OECD DAC Creditor Reporting System, Notre Dame Global Adaptation initiative (NG-GAIN), UN Multidimensional Vulnerability Index, IPC/CH, and UNOCHA data.
Notes: Food insecurity gap combines IPC/CH assessments of Phase 3+ food insecurity and UN-coordinated humanitarian needs assessments of populations facing food insecurity. Bubbles scaled according to adaptation funding to the country. See the ‘Key Definitions’ section (at the bottom of the page) for more information.
These charts present insights into the climate finance landscape, highlighting the countries and regions that receive the most finance, and where gaps remain. Action is needed to ensure improved responses to people’s needs, improved quantity and quality of climate financing and improved transparency and reporting.
Accelerating climate impacts can create new (or worsen existing) humanitarian crises. In the context of the existing humanitarian finance gap, it is critical that resources are targeted and channelled effectively across the humanitarian–development–peace nexus. Climate finance is a critical component of resilience-building, yet not enough of it reaches the places that need it the most, due in part to the challenges particular to fragile and conflict-affected states. Places facing prolonged conflict and socioeconomic fragility need more and better finance that is informed by local priorities and rapidly deployed to address climate losses and damages.
This data includes all ODA disbursements reported to the OECD DAC Creditor Reporting System (CRS) and marked with a relevant Rio marker by DAC members, multilateral organisations and other government donors that voluntarily report to the OECD DAC. The two Rio markers can be used to report the relevance of any ODA funding in terms of:
We include ODA marked as principal only for both markers.
Our definition of protracted crisis countries includes countries with five or more consecutive years of UN-coordinated appeals, as of the year of analysis. The types of appeals and response plans used to determine this classification are outlined in ‘UN-coordinated appeals’.
We have chosen this approach to give an indication of the countries that have consistently, for a number of years, experienced humanitarian needs at a scale that requires an international humanitarian response. Those needs can be limited to specific geographical regions or populations (such as forcibly displaced people).
Acute food insecurity classification data is from the Integrated Food Security Phase Classification / Cadre Harmonisé (IPC/CH), supplemented by UNOCHA’s Humanitarian Programming Cycle (HPC). From IPC/CH, we classify people living in ‘crisis’, i.e. Phase 3 or higher, as being acutely food insecure. From UNOCHA HPC, we classify those in need of humanitarian assistance under the food security sector as being acutely food insecure. Acute food insecurity numbers and phases are as reported or projected by the data year’s most comprehensive IPC/CH survey or UNOCHA HPC appeal year.
Country-level food insecurity phases are calculated based on IPC/CH’s methodology of the highest phase experienced by at least 20% of the population. For countries with only UNOCHA HPC data, we estimate whether the country-level phase is either above or below equivalent Phase 3 (3-, 3+) based on the number of people in need under the food security sector.
For a trend comparison at a country level, we use data from before the Covid-19 pandemic (2017/18/19), against the most recent data year available (2022/23). Data for 2023 is preliminary, relying on partial data, projections from IPC/CH and forward-looking estimates from UNOCHA. These estimates are subject to change, both at a country level and in terms of which countries are assessed.
Food insecurity severity is calculated based on an adapted Foster-Greer-Thorbecke (FGT; α=1) index that weights higher phases of food insecurity to produce a comparable index of severity.
This initial version of the interactive was a collaborative effort, including writing from Erica Mason and Thea Wright, analysis by Guilherme Monteiro and Dan Walton, technical development by Thatcher Kaliisa, and editorial guidance from Simon Murphy.
Donors and African domestic budget allocators must consider the impact of climate change on women and girls with disabilities when making financing decisions
This briefing examines the gendered impacts of climate change on women and girls, using Rwanda as a case study. It analyses the reporting, availability and tracking of gender-relevant climate finance, and the barriers that hinder women's rights organisations' access to finance.
What volume and proportion of finance to African countries for climate action came as loans in 2022? Is it targeting need? We look at data from the DAC, IDA and China.