Key facts
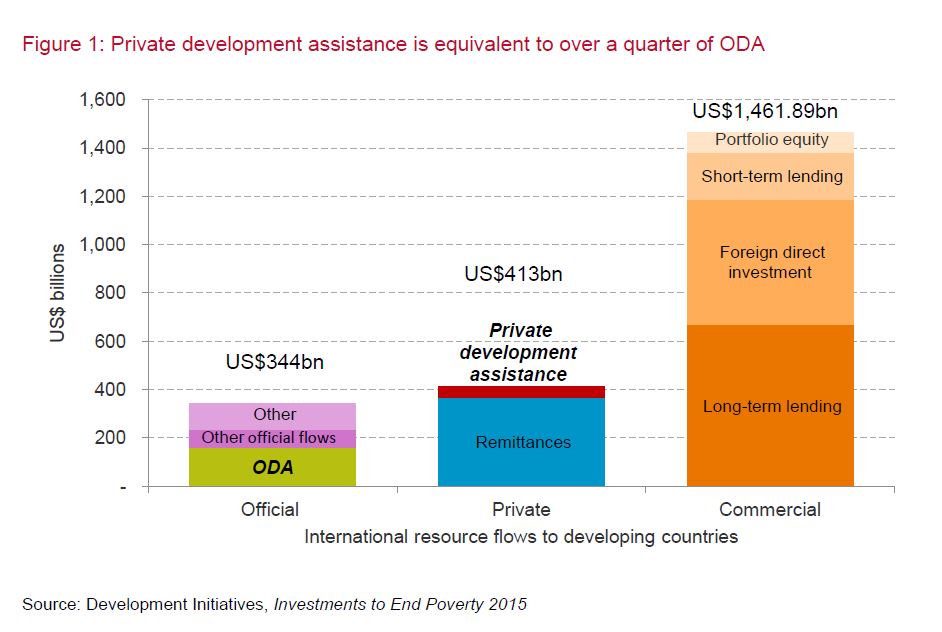
- Private development assistance is estimated at US$44.6 billion, equivalent to over a quarter of all official development assistance (ODA) to developing countries; however, data limitations mean that this figure is an underestimation of actual volumes
- Some private organisations provide volumes of assistance on par with government donors
- Non-governmental organisations (NGOs) provide over half of the estimated private development assistance; they also act as channels of delivery for around 16% of total bilateral ODA
- Data limitations mean that we do not have an accurate picture of the trends or characteristics of this type of finance, including how and where it is being spent – this limits informed discussion about the role and comparative strengths of private development assistance actors in the Sustainable Development Goals (SDG) era
Private development assistance is equivalent to over a quarter of Organisation for Economic Co-operation and Development (OECD) Development Assistance Committee (DAC) ODA
Private development assistance includes all international concessional resource flows voluntarily transferred from private sources for international development. These flows are the private finance channelled through NGOs, foundations and corporate philanthropic activities. Other terms used interchangeably with private development assistance include international private giving, international philanthropy, voluntary giving, private development aid, and private development cooperation.
Our latest estimate finds that annual private development assistance from 24 countries[1] is around US$44.6 billion in aggregate.[2] This is equivalent to over a quarter of all ODA provided to developing countries by DAC countries and multilateral institutions.[3]
Over two thirds of all private development assistance comes from private sources in the United States
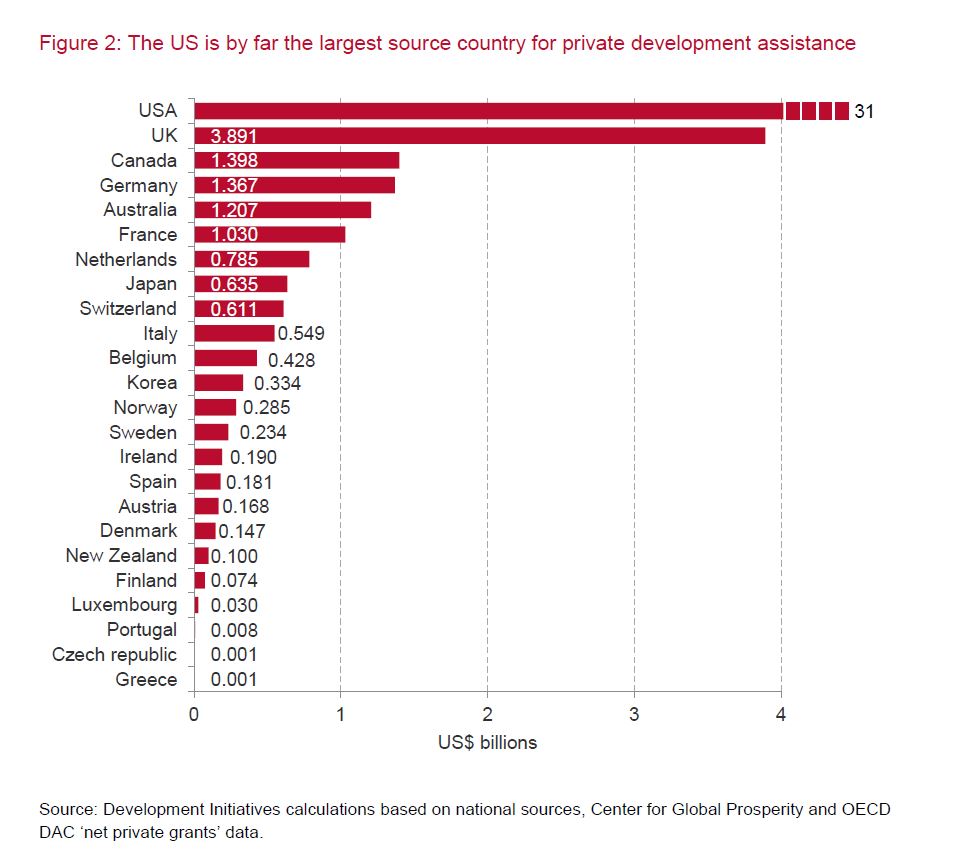
Out of the 24 DAC countries for which private development assistance estimates are available, the United States (US) is the largest source country, contributing US$31 billion – more than the US$27 billion it provided as aid in 2013.
This suggests that among DAC countries, the US is an even more significant contributor of private development assistance (providing 69% of the total in 2013) than of ODA (17% of the total in 2013).
The second largest source country for private development assistance is the United Kingdom (UK), providing an estimated US$3.9 billion, which is equivalent to over a third of its ODA in 2013. Canada, Germany, Australia and France are estimated to provide between US$1 billion and US$1.4 billion of private development assistance annually. Five countries are estimated to provide less than US$100 million. It is important to note that countries with more comprehensive data on private development assistance from different providers, including foundations and corporations engaging in philanthropic activities, will appear more generous.
NGOs are the largest providers of private development assistance
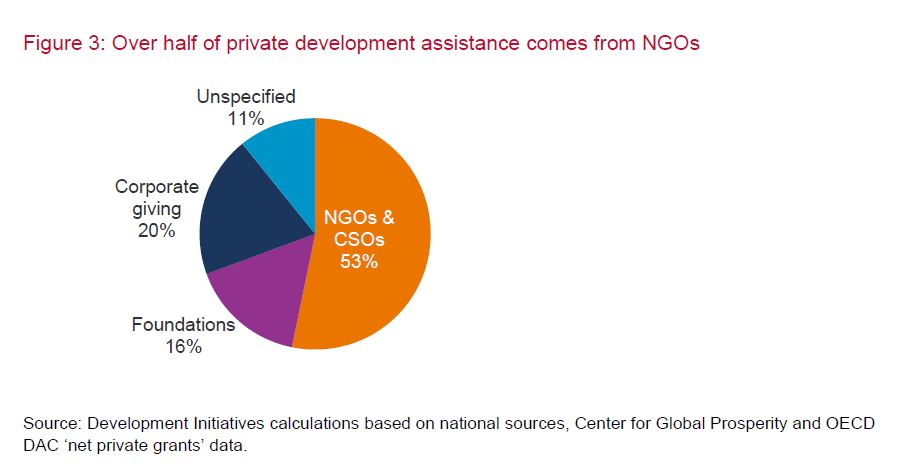
For 18 out of the 24 countries for which private development assistance estimates are available, data can be disaggregated by different types of providers – such as NGOs, foundations and corporations engaging in philanthropic activities. Estimates suggest that NGOs are the largest providers of private development assistance, contributing 53% of the total US$44.6 billion (although more data is available on NGOs than on foundations or corporate spending, which is likely to skew findings).
According to the available data, corporations provided an estimated 20% or US$8.8 billion and foundations provided 16% or US$7.2 billion (of which US$6.6 billion was from US foundations). Some 11% of private development assistance was classified as “unspecified” since data could not be disaggregated by provider type, for example in the case of OECD net private grants data.
Private development assistance from large organisations is comparable to ODA from some goverment donors
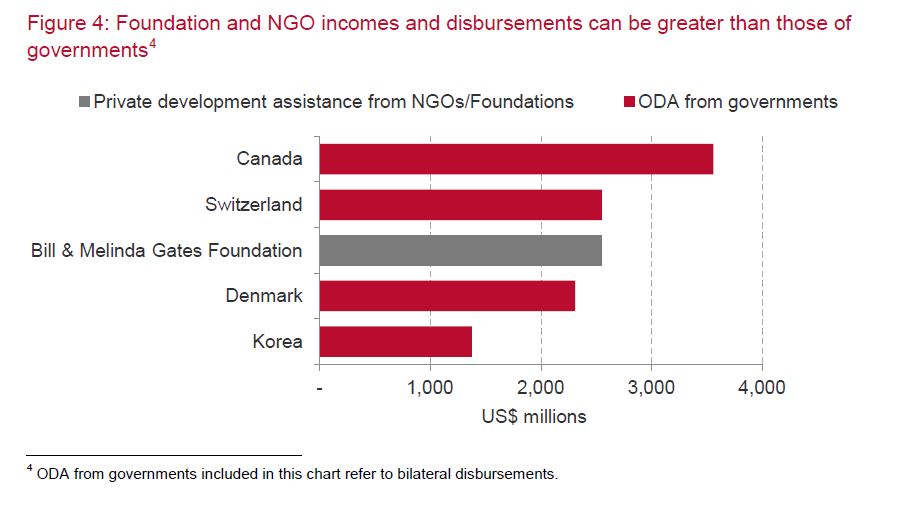
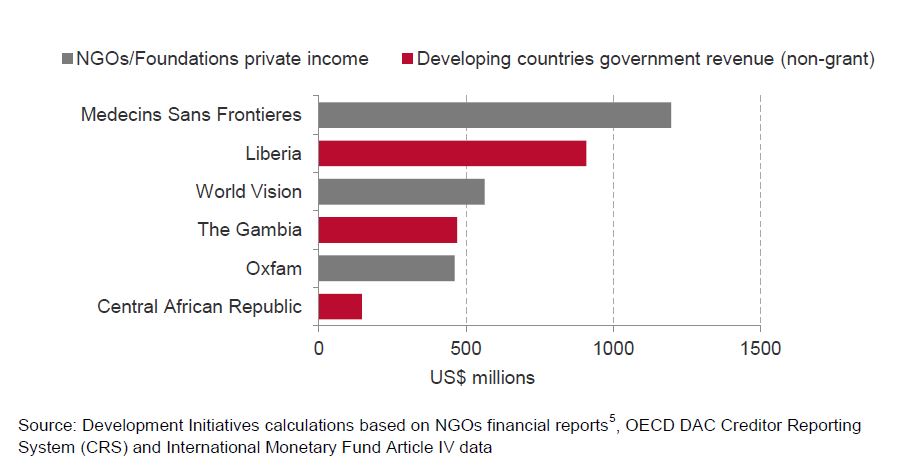
The largest NGOs and foundations channel private development assistance comparable to the spending of some government donors and collect private income comparable to the national revenues of some developing countries. For example, if the Bill & Melinda Gates Foundation was a government donor, it would be the 12th largest among DAC countries. Its US$2.5 billion disbursements to developing countries are US$234 million greater than bilateral ODA from Denmark, and only US$7 million lower than disbursements from Switzerland. Taking income, that collected by Medecins Sans Frontieres in 2013 was over eight times larger than national non-grant revenues of the Central African Republic.
Tracking trends in private development assistance: a recent stagnation?
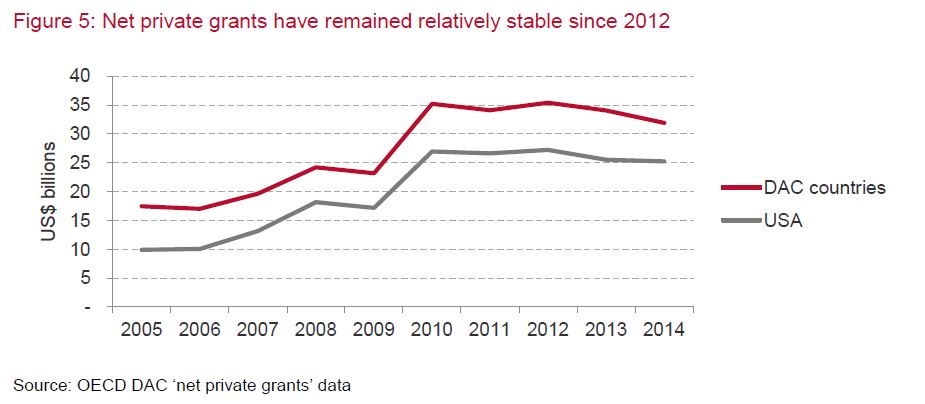
OECD data on net private grants[6] provides insights into trends in private development assistance volumes. The data suggests that while total levels were rising between 2005 and 2010, they stagnated between 2010 and 2012 and have decreased since. However, this is to be interpreted with care as lack of consistent reporting may be skewing overall trends.[7]
The data also shows that global private development assistance trends are closely related to recorded changes in US figures – this is not surprising since private development assistance from the US accounts for over two-thirds of the total. A 2013 assessment of US giving to international causes suggests that the recent stagnation in private development assistance levels is due to slow economic recovery after the financial crisis and higher contributions to local communities rather than to international efforts. Similarly, in the UK, the Charities Aid Foundation suggests that confidence in the UK has still not fully recovered following the financial crisis and private individuals are more likely to spend extra disposable income on holidays and personal items than on donating to charity.
The Global Humanitarian Assistance Report 2015 and a recent briefing paper on humanitarian assistance from non-state donors provide further insight into private giving trends. Although related specifically to giving in response to crises, findings corroborate broader private development assistance trends. They suggest that private donors tend to respond more generously to rapid onset and natural disasters than to chronic and conflict-related crises. In fact, although private giving in the humanitarian sector has risen year-on-year since 2012, it has done so at a much slower pace than has humanitarian assistance from governments – one possible explanation being that most humanitarian crises in 2013 and 2014 were chronic or conflict-related.[8]
The share of ODA through NGOs is constant while the volume is increasing
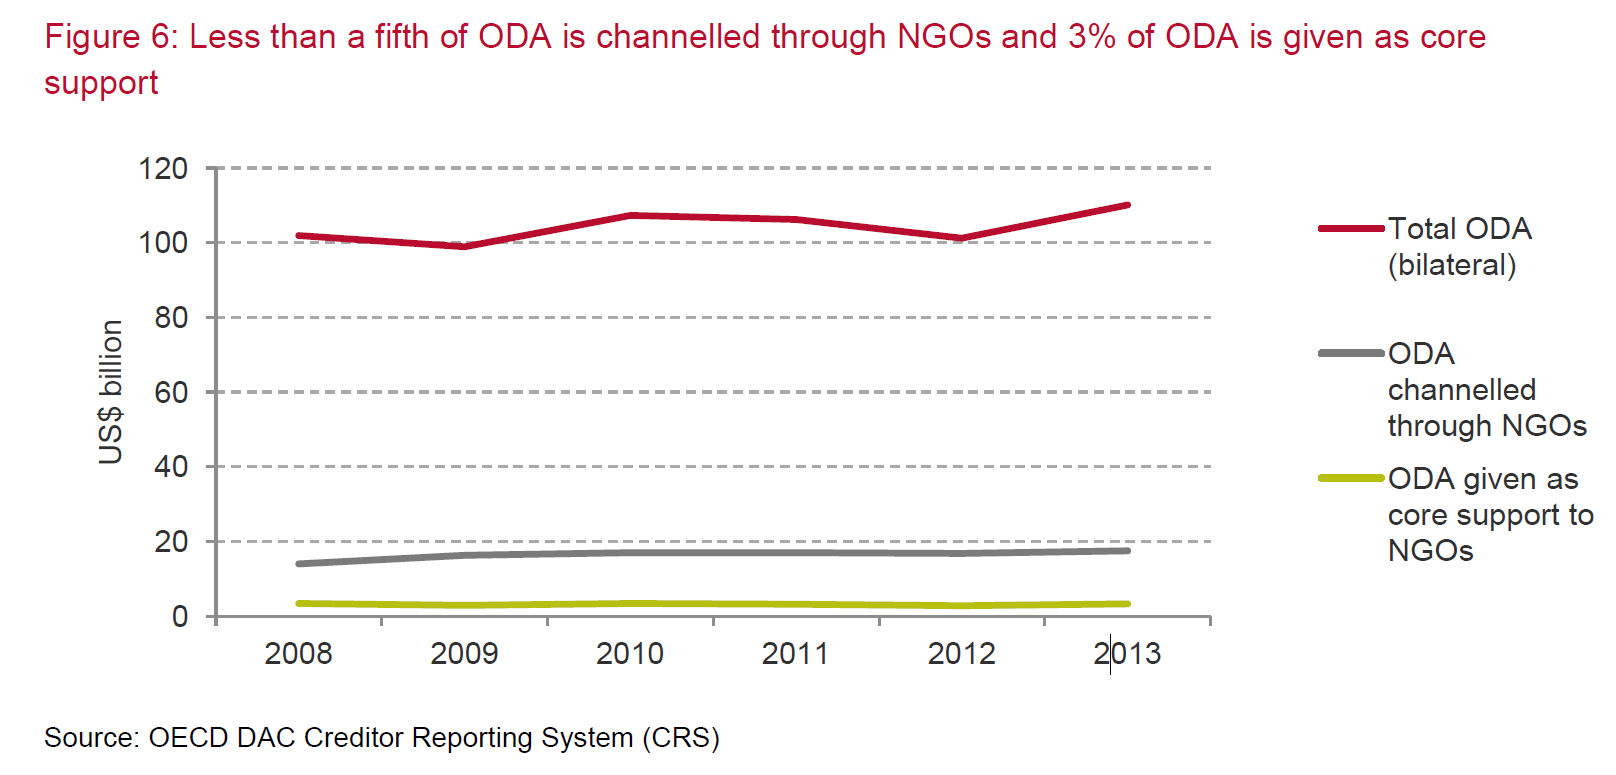
In addition to private funding, NGOs also receive ODA from DAC governments. ODA is received both as aid channelled through NGOs where donors have control over the outcome of their money, and ODA given as core support to NGOs where donors do not manage how their money will be invested.[9]
The share of ODA channelled through NGOs has remained relatively constant between 2008 and 2013, averaging 16% of the total.[10] Approximately 3% of ODA from DAC donors has been going to NGOs as core support over the same period. While the shares of ODA to and through NGOs have remained consistent, the volume of ODA channelled through NGOs has increased alongside the rise in total ODA. Total bilateral ODA from DAC donors has risen from US$102 billion in 2008 to US$110 billion in 2013. ODA channelled through NGOs has risen from US$14.0 billion to US$17.6 billion in the same years. Core support – a small part of total ODA – has remained unchanged at around US$3 billion.
An incomplete picture of private organisations’ contributions to development
Unlike ODA, estimating private development assistance presents multiple challenges caused by data gaps and a lack of methodological standardisation for defining private development assistance within and across countries.
With no comprehensive mechanism for capturing private development assistance, estimates are compiled from a variety of sources including the OECD’s ‘net private grants’ data, national sources for particular countries and indexes such as those compiled by the Center for Global Prosperity.
In addition to limitations in measuring global private development assistance, disaggregated data is also lacking thus making it difficult to analyse how, when, where, by who and on what this type of resource is spent. Disaggregated data by source and by expenditure in recipient countries, including at sub-national level and by sector, is not systematically available. Shortcomings with the data mean that the estimates we have are not comprehensive enough to be precise figures. This lack of accurate data presents a significant constraint on our ability to understand and evaluate the impact, comparative strengths and role that private development assistance actors should play in the Sustainable Development Goals era.
Photo credit: Eddy Mbuyi/Oxfam, January 2013
