Key facts
- Funding to conflict prevention and resolution, peace and security (CPS) remains a small proportion of overall official development assistance (ODA).
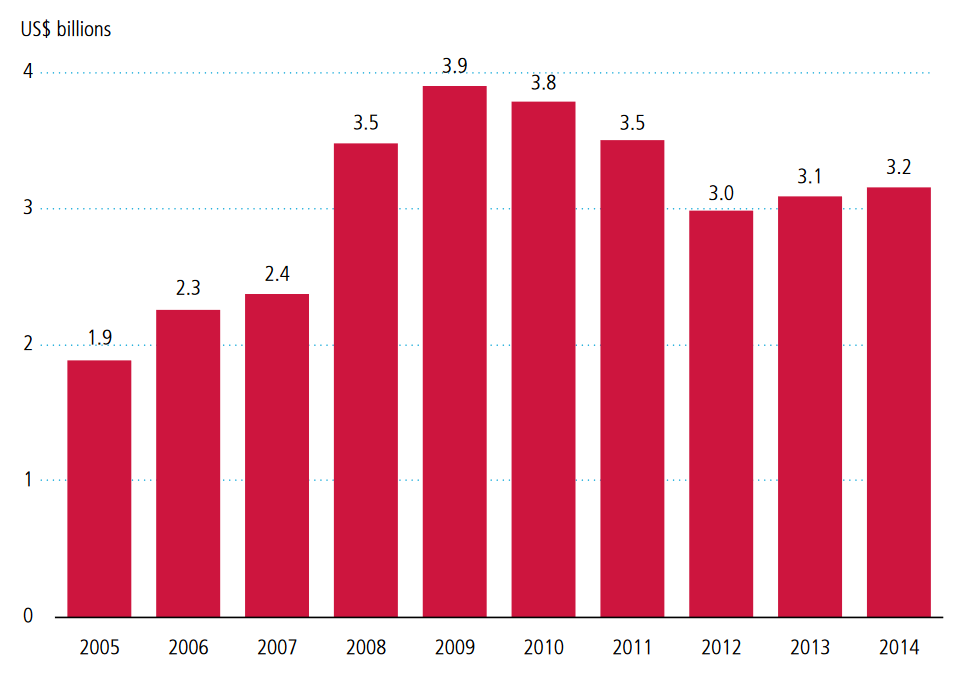
- ODA CPS has increased by 67% since 2005, reaching a peak of US$3.9 billion in 2009.
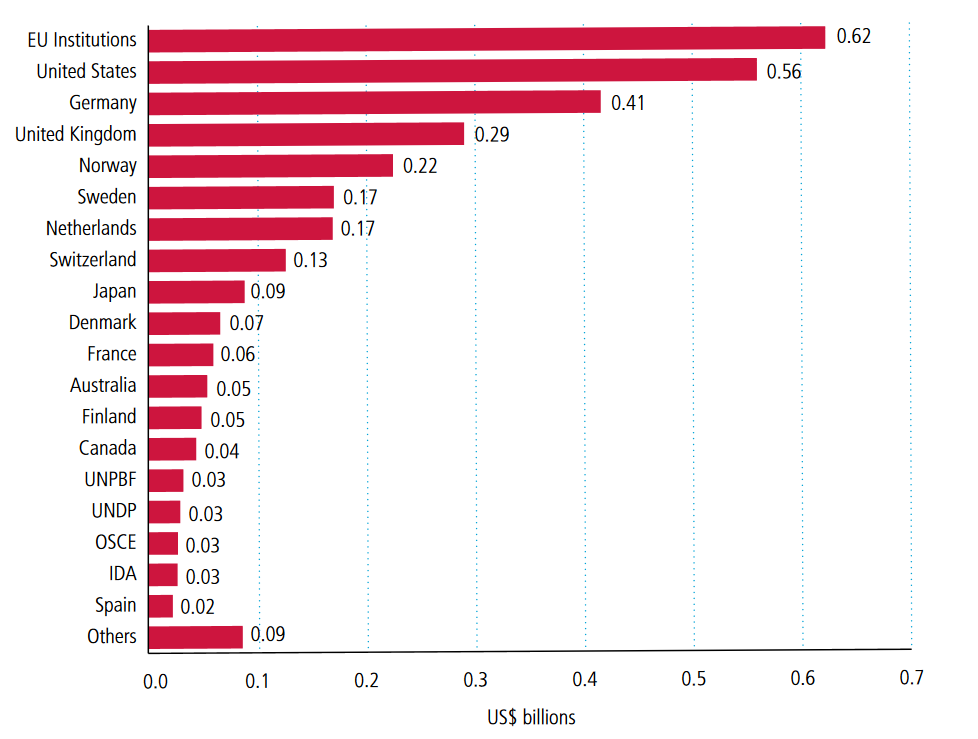
- The largest CPS ODA donor in 2014 was European Union (EU) institutions.
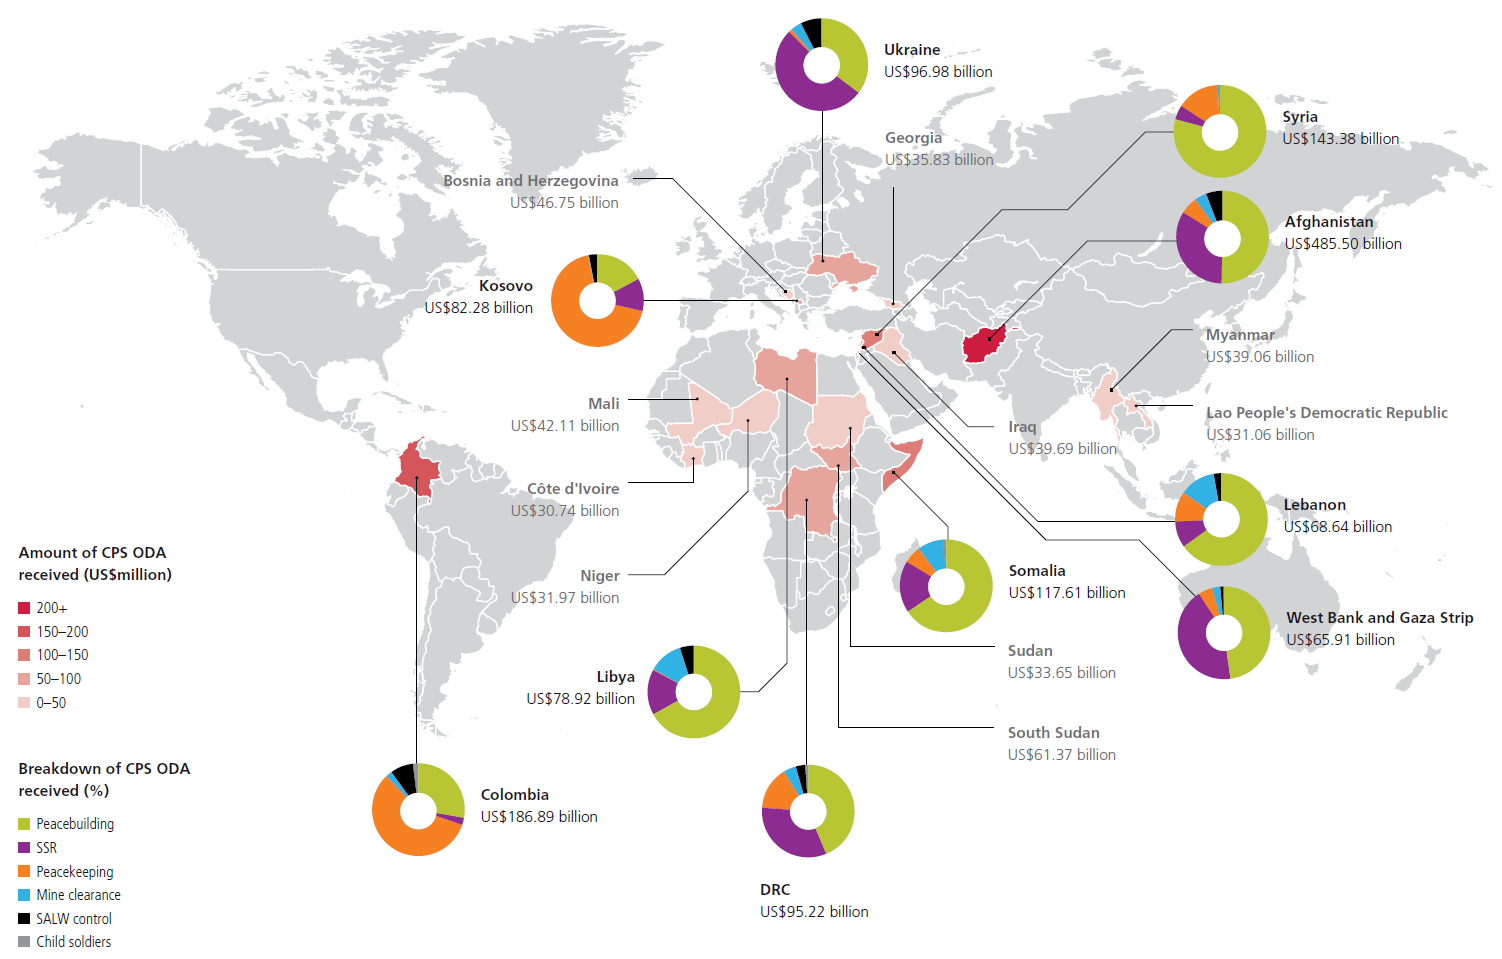
- Afghanistan received the most CPS ODA by country in 2014.
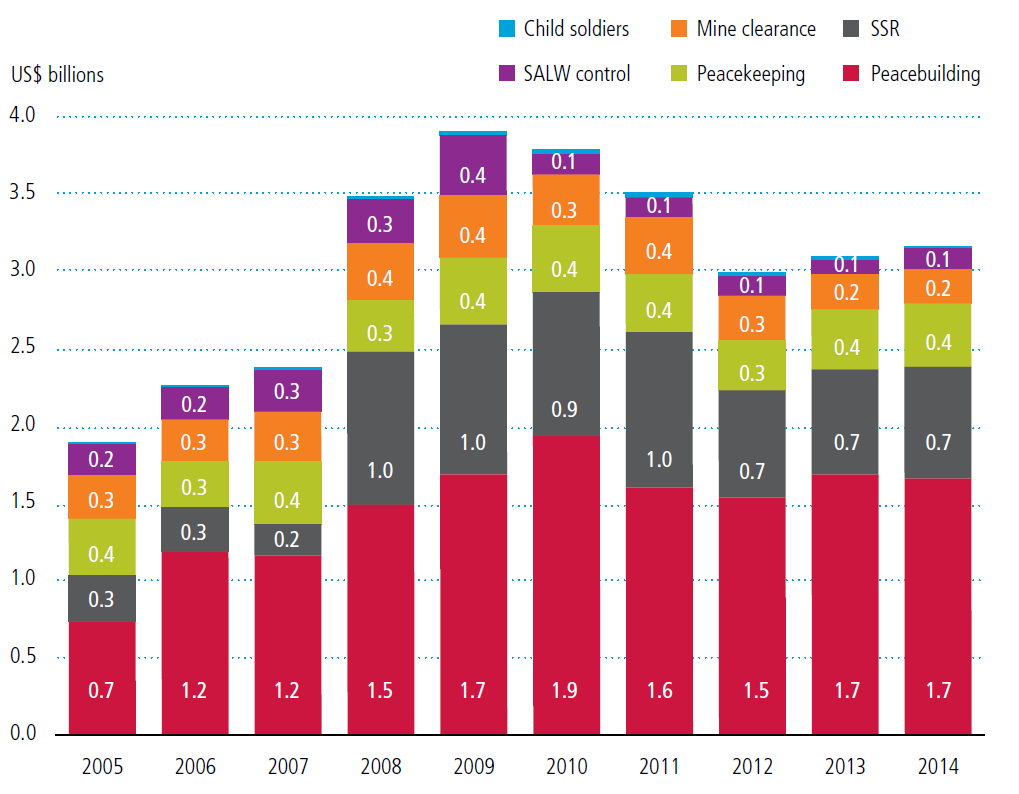
- The majority of CPS ODA goes to peacebuilding activities.
- Funding through the public sector (donor and recipient governments) comprised the largest proportion of total CPS ODA in 2014 (32.7%).
Official development assistance (ODA) to conflict prevention and resolution, peace and security (CPS) is an important resource for supporting the transition from conflict to peace and paving the way to longer-term development, but is a much smaller resource than other investments. In 2014, CPS comprised only 1.9% (US$3.2 billion) of total reported ODA. Yet significantly more ODA may be spent on CPS-related activities and reported under other categories in the Organisation for Economic Co-operation and Development (OECD) Development Assistance Committee (DAC)’s single-purpose code reporting system and therefore not captured in these figures.
How much was given?
CPS ODA funding has increased by 67% since 2005, reaching a peak of US$3.9 billion in 2009 after an increase of US$1.1 billion (47%) from 2007 to 2008 alone. Funding has since declined to US$3.0 billion in 2012, and has stabilised since then (see Figure 1).
Increased funding in response to the crises in Iraq and Afghanistan explain this significant rise in CPS ODA between 2007 and 2009. The leap is also explained by a rise in funding to security sector reform, which quadrupled between 2007 and 2008 (up US$787 million).
Figure 1: CPS ODA 2005–2014
Source: OECD Creditor Reporting System (CRS) online database
Where does it come from?
Figure 2: Largest providers of CPS ODA, 2014
Source: DI calculations based on CRS online database and CRS 2014 download
Notes: IDA: International Development Association; UNDP: United Nations Development Programme.
The largest CPS ODA donor in 2014 was EU institutions, providing contributions totalling US$0.62 billion – almost one-fifth of all CPS ODA. Of country donors, the United States (US) provided the largest volume of spending (US$0.56 billion), followed by Germany (US$0.41 billion), and the UK (US$0.29 billion) (see Figure 2). The US, Germany and the United Kingdom (UK) have consistently provided the most since 2011.
The United Nations Peacebuilding Fund (UNPBF) and the Organisation for Security and Co-operation in Europe (OSCE) invest the largest shares of their ODA in CPS activities when compared with other donors. This is unsurprising considering their specific mandates to promote peace and security. Of country donors, Estonia allocated the largest proportion of its ODA to CPS in 2014 (9%), followed closely by the Slovak Republic (8.6%) and Slovenia (8.0%).
Where does it go?
Afghanistan received the most by country – over a seventh of total CPS ODA in 2014 (15.4%), followed by Colombia at 5.9% of total funding, while Syria received 4.5% (see Figure 3).
Figure 3: 10 largest CPS ODA recipient countries, 2014, with sub-sectors
Source: Development Initiatives’ calculations based on CRS 2014 download
What is it spent on?
During the last decade, peacebuilding activities have consistently received the majority of CPS ODA (52.5% in 2014).This may partly reflect that ‘peacebuilding’ as a category covers a broader range of activity types than do other CPS purpose codes such as mine clearance or security sector reform, each of which is related to a specific type of technical activity. Peacebuilding is a wide category ranging from support for peace processes, political negotiations and local governance, to capacity building for civil society, and technical support/advisory services.
The largest proportion of CPS funding to the largest 10 recipient countries went to peacebuilding activities (Figure 4), where it accounted for more than half of CPS ODA to Afghanistan, Syria, Somalia, Libya and Lebanon in 2014.
Figure 4: Trends in aid to CPS sub-sectors. 2005–2014
Source: DI calculations based on CRS 2014 download
How does it get there?
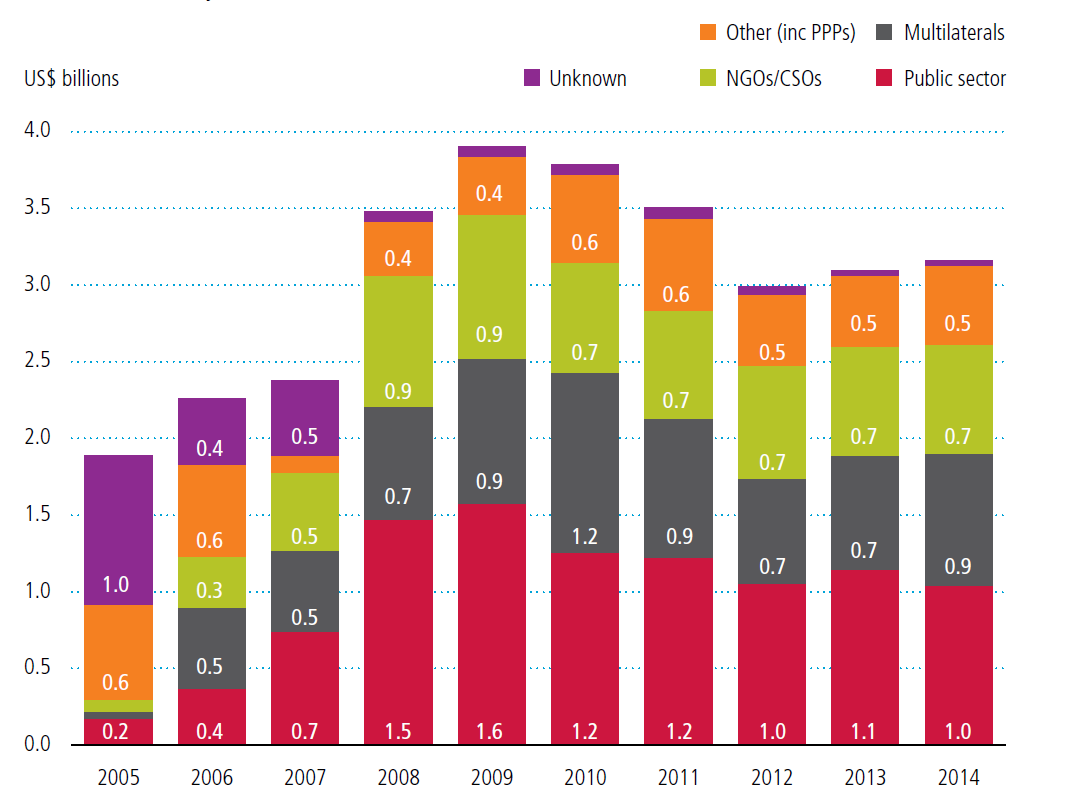
Funding through the public sector (donor and recipient governments) comprised the largest proportion of total CPS ODA in 2014 (32.7%). The proportion channelled through the public sector, multilateral agencies and non-governmental organisations (NGOs)/civil society organisations (CSOs) has increased over the last decade (see Figure 5). This is largely because funding reported in the ‘unknown’ category fell substantially from 52% in 2005 to just 1.2% in 2014, suggesting an improvement in reporting.
Figure 5: Channels of delivery for CPS ODA trends, 2005–2014
Source: DI calculations based on CRS 2014 download.
Note: Sub-categories stated are abbreviated from full names in the CRS (see Annex 1, Table 2 in our 2016 report Investment in peace and security for full sub-category names and descriptions).
The findings in this factsheet are taken from the recently published report Investments in peace and security, available here: https://devinit.org/#!/post/investments-in-peace-and-security.
Contact
Sarah Dalrymple, Senior Policy and Engagement Advisor
T: 01179 272505 | E: [email protected] | www.devinit.org
