Key findings
- Official development assistance (ODA) increased to a new peak in 2015: Collectively ODA from the 28 Development Assistance Committee (DAC) donors totalled US$146.7 billion in 2015, compared with US$137.2 billion in 2014. (US$ figures throughout are 2014 constant prices.)
- 22 of the 28 DAC countries reported a real-terms increase in ODA: The largest increase in ODA in monetary terms came from Germany – a rise of US$4.3 billion, or 26%. This meant Germany overtook the UK as the second largest donor after the US. The largest percentage increases were from Greece (39%) and Sweden (37%).
- Most of the rise in ODA was due to increased spending on refugees within donor countries: ODA targeted on the sustenance of refugees housed in donor countries rose from US$6.6 billion in 2014 to US$13.9 billion in 2015 – by far the largest figure ever recorded. European donors most strongly affected by the ongoing refugee crisis showed large proportional increases in their total ODA between 2014 and 2015.
- However ODA excluding refugee costs also rose: When spending on refugees in donor countries is subtracted from the total, the remaining ODA also showed an increase of US$2.2 billion or 1.7%.
- The US reduced ODA disbursements significantly: Total ODA from the US fell by US$2.3 billion, a reduction of over 7% compared with 2014. Australia also continued its recent trend of cutting ODA, recording a real-terms decrease for the 3rd straight year – Australian ODA is now almost US$900 million below its 2012 peak.
- Six DAC donors now meet 0.7% (up from five in 2014): Sweden, Denmark, Norway, Luxembourg and the UK all maintained ODA above the UN 0.7% of gross national income (GNI) target. The Netherlands increased its ODA to above 0.7% of GNI for the first time since 2012, partly due to increased spending on hosting refugees.
- Most donors reported increased ODA as a proportion of GNI: 17 donors reported an improvement in this measure. Again some, though not all, of these increases are due to increased spending on hosting refugees.
- After falling in 2014, ODA to LDCs rose in 2015: However ODA to LDCs is still significantly below its 2011 peak and just seven donors met the target of giving at least 0.15% of GNI as ODA to LDCs. (Germany has yet to provide preliminary 2015 data on ODA to LDCs – for the purposes of this briefing, it has been assumed that Germany’s ODA to these countries was approximately the same in 2015 as in 2014.)
- Loans again increased, but the rate of increase in bilateral lending was slower than previous years: New gross bilateral lending from DAC-28 donors rose 4% between 2014 and 2015. Lending from France actually fell by 5%, but Germany continued its recent trend of increased lending, disbursing US$6.3 billion of loans in 2015 – 28% higher than in 2014.
Figure 1: Most donors increased ODA disbursements in 2015
Proportional changes in DAC donors’ ODA, 2014–2015 (constant US $ 2014 prices)
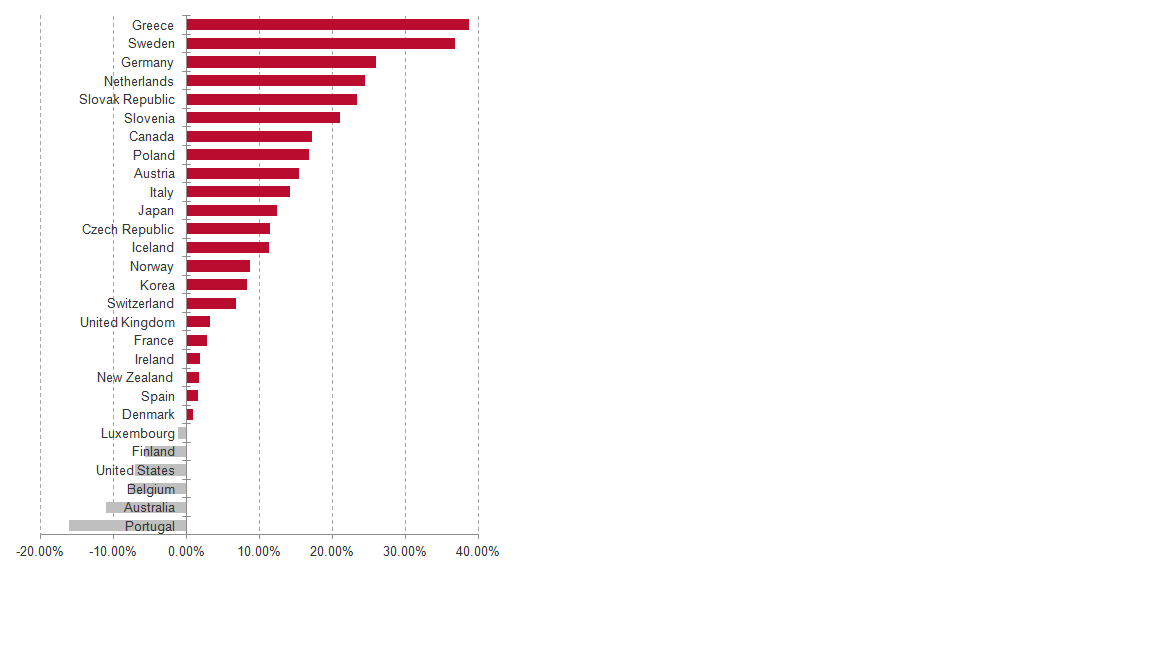
Source: Development Initiatives, based on OECD DAC data
Figure 2: Six donors reported ODA exceeding 0.7% of GNI in 2015
Changes in ODA/GNI proportion, 2014–2015
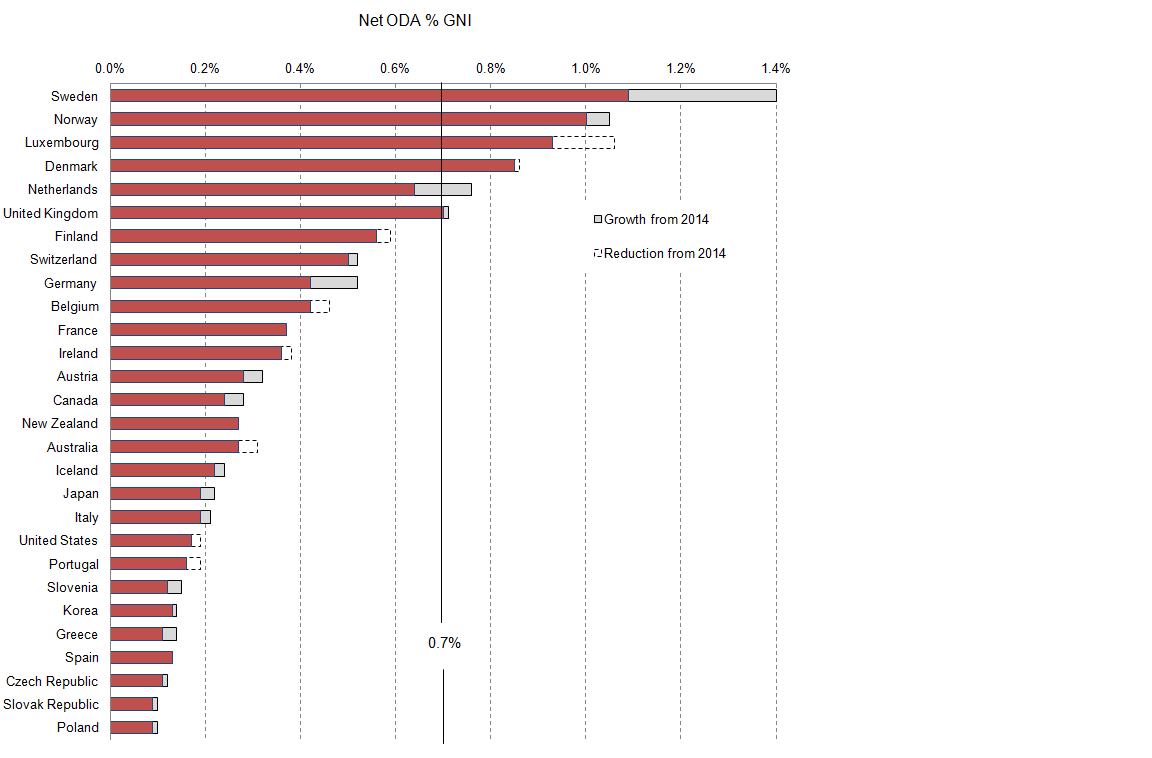
Source: Development Initiatives, based on OECD DAC data
Table 1: Headline figures for 2015 preliminary ODA data, by DAC country donor
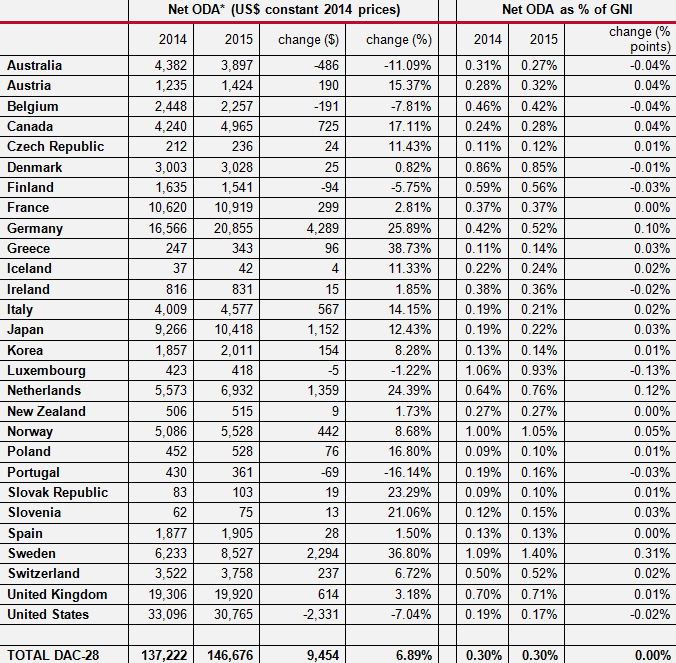
Source: Development Initiatives, based on OECD DAC data
Note: *Including multilateral ODA
Figure 3: Spending on the hosting of refugees doubled, but other forms of ODA rose as well
Total ODA 2006–2015, showing amount spent on refugees in donor countries
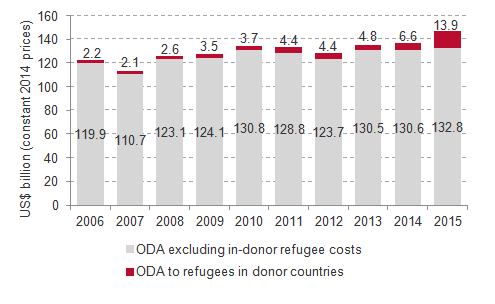
Source: Development Initiatives, based on OECD DAC data
Figure 4: ODA to LDCs rose slightly, but is still below the 2010 level
Bilateral ODA from DAC donors to LDCs 2005–2015
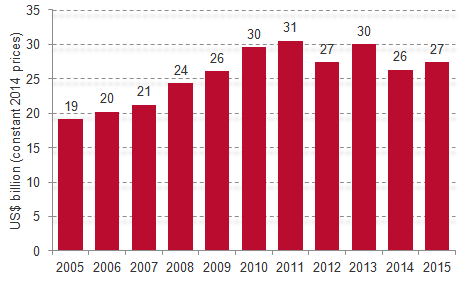
Source: Development Initiatives, based on OECD DAC data
Figure 5: Only 7 donors gave more than 0.15% of GNI as ODA to LDCs
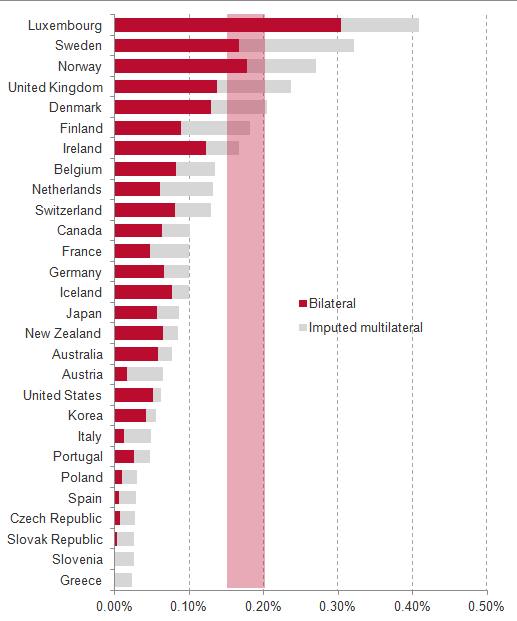
Source: Development Initiatives, based on OECD DAC data
Note: Germany has yet to provide preliminary 2015 data on ODA to LDCs – for the purposes of this briefing, it has been assumed that Germany’s ODA to these countries was approximately the same in 2015 as in 2014.
Table 2: Loans continue to grow, but the proportion of ODA given as bilateral loans stayed the same in 2015
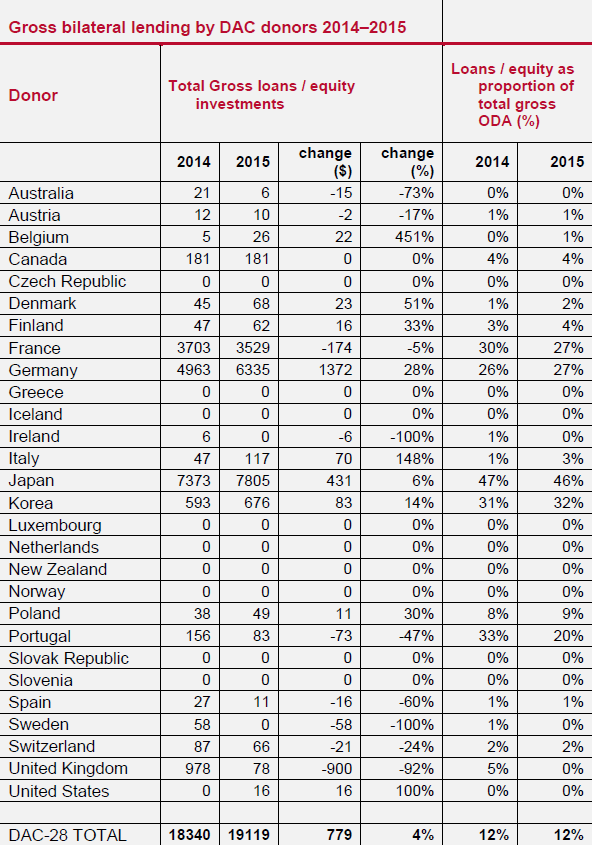
Source: OECD, DAC 2015 provisional data release, ADV spreadsheet, 13 April 2016
Contact
Rob Tew, Head of Technical Development
Photo: Ben White/ CAFOD, October 2015


