Why focus on the poorest 20% of people globally?
We have seen real successes in reducing extreme poverty worldwide. Global incomes have gone up and many countries have seen national income per person rise substantially. But this does not always translate into benefits for the poorest people. The poorest 20% received less than 2% of world income gains over the two decades to 2008.[1]
The poorest 20% of people globally includes everyone living below the $1.25-a-day extreme poverty line. It also includes those people who live just above that line and who are vulnerable to falling back under it. Actively prioritising this group’s needs means focusing on them as individuals, moving attention away from a country-driven view of poverty to focus much more locally. It means understanding who the poorest people are, where they live, identifying the challenges and vulnerabilities they face, the resources they have access to and the investments that transform their opportunities. This clearly demands disaggregated data to reveal progress or investment below the national level to what is being invested in the poorest 20%.
Inequalities of income, opportunity and access to basic services mean that approaches based on average national income cannot provide the data needed for good targeting of scarce resources to end poverty. Focusing on and measuring progress of the poorest 20% also supports global sustainable development ambitions, going beyond the minimum standard of $1.25 a day to sustained progress on ending extreme poverty and reducing inequality. Bringing greater visibility to the status of the poorest 20% of people globally – their shares of investment received and their progress – will help to mobilise domestic and international efforts and, end poverty and ensure that no one is left behind.
Who are the global poorest 20%?
In 2011 there were 1.4 billion people in the global poorest 20%. The best available data for the same year suggest the poorest 20% of people had daily incomes of $1.48 or less.[2]
These figures are derived from the same national household surveys as the $1.25-a-day extreme poverty line, which is based on the national poverty lines of the world’s 15 poorest countries and likely to be core to the post-2015 development agenda.
The poorest 20% of people live in – or are highly vulnerable to falling back into – extreme poverty. Focusing on the poorest 20% therefore helps to achieve the goal of ending extreme poverty by 2030, while establishing a dynamic principle for future sustainable development that evolves with global progress.
Ending extreme income poverty is important, but it is only a first step. Poverty is multidimensional, although low incomes are very often associated with wider deprivations. Data is currently most readily available on the incomes of the poorest 20%, but more information on the poorest 20% in all dimensions of poverty is needed to understand the wider challenge.
Where do the global poorest 20% of people live?
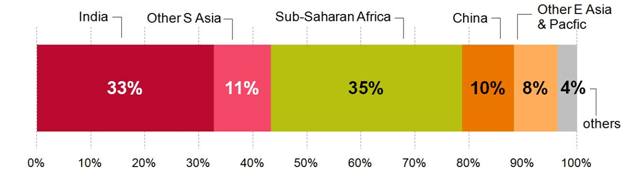
Two world regions are home to almost four‑fifths of the people in the global poorest 20%: South Asia (43%) and sub-Saharan Africa (35%). Three countries account for over half of people in the global poorest 20%: India one third, China one tenth, and Nigeria 8%.
People in the global poorest 20% are mostly in South Asia and sub-Saharan Africa
However, distribution alone is not sufficient to understand the extent of poverty. One third of the poorest 20% of people globally, some 441 million people, live in least developed countries (LDCs). Depth of poverty – how far below the poverty line poor people’s incomes are – also tends to be greater for those in the poorest 20% that live in LDCs. All of the 20 countries in with the largest poverty gap are LDCs apart from one, Nigeria.[3] Poverty depths range from 55% in Madagascar to much lower levels of 9% in India and 2% in China, to just 0.1% in Turkey, although even in these countries poverty may still be concentrated in particular states.
The countries where the global poorest 20% live tend to be low capacity and vulnerable. Some 73% of the poorest 20% live in countries where government spending per person in 2011 was below $1,500 a year, while 28% of the poorest 20% are in countries where the figure is below $500 a year. These compare with $15,700 a year in high-income countries.[4] Nearly all (99%) of the people in the poorest 20% live in countries considered to be environmentally vulnerable, which include China and India, or seen as politically fragile, or both.
Achieving the end of extreme poverty by 2030 requires attention, investment and data on and from the poorest 20% of people globally and on those in extreme poverty in particular. It will help to accelerate progress, ensure sound investments and ensure that no one is left behind.
[1] Lakner & Milanovic, Global income inequality paper, Winter 2013–14, slide 27 and underlying data.
[2] Income data are from World Bank PovCalNet models and are for 2011 (at 2005 purchasing power parity). All people in developed countries for which there are no poverty data (covering around 1 billion people) are assumed have incomes above $1.48 a day.
[3] This measure comes from PovCalNet, and represents the average gap for the whole population of each country, with everyone above the poorest 20% line (PPP$1.48) counted as having a zero gap.
[4] 2011 government spending per person (at 2011 purchasing power parity) from IMF World Economic Outlook.


