People in rural areas risk being left behind as aid to water and sanitation appears to provide better support to urban areas
Today we celebrate World Water Day 2016,[1] coordinated by UN-Water as a reminder that water has the power to transform people’s lives.
While the world met the Millennium Development Goals (MDGs) target of 88% of people accessing improved[2] water sources, 748 million people were still using unimproved water sources in 2012 with rural areas lagging behind in access, particularly in least developed countries and in sub-Saharan Africa.[3]
Financing for water and sanitation is the key for countries to achieve Goal 6 of the Sustainable Development Goals (SDGs): Ensure availability and sustainable management of water and sanitation for all. All financial resources play a role in supporting the delivery of basic services including water and sanitation, and aid plays a unique role in the way it can be targeted to poverty reduction and service delivery in the most deprived and vulnerable contexts. Where domestic financial resources are lacking, aid is a vital resource that can be targeted to meet needs in water and sanitation.[4]
Figure 1: Aid to water and sanitation, constant 2013 prices, 2003 to 2014

Source: OECD Development Assistance Committee (DAC) Creditor Reporting System (CRS)
Aid for water and sanitation appears to provide relatively less support to rural areas
Aid to water and sanitation has steadily increased in volume, at a similar pace to overall ODA. ODA to the sector consistently represents 4–5% of all ODA;[5] however, available data indicates that people in rural areas may be being left behind. Using a qualitative assessment of project descriptions in the OECD DAC CRS database, 952 projects can be identified that specifically refer to “rural” support. These projects amount to US$594 million, with average project volume at US$0.6 million. Meanwhile, 1,601 projects refer to “urban” support, and amount to US$1.4 billion, with average project volume at US$0.9 million.[6] We note, however, that the majority of aid projects in water and sanitation do not clearly indicate whether rural or urban areas are targeted. US$4.5 billion (69.5% of the water and sanitation projects) couldn’t be grouped as supporting either rural or urban areas. Therefore this data is indicative of relative funding allocations, with a clear need for donors to improve reporting.
Figure 2: Rural and urban investments in water and sanitation for 2013 against 2012 global access indicators, constant 2012 prices
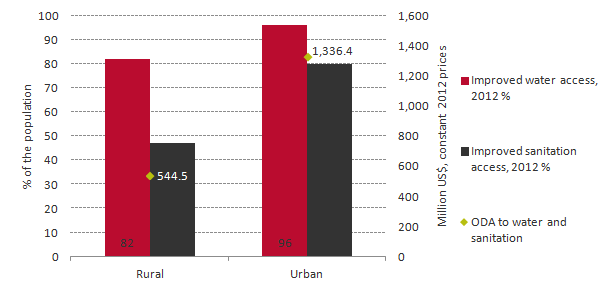
Source: Development Initiatives based on OECD DAC CRS and Joint Monitoring Programme data
Crucially, in rural areas there is relatively low access to improved water and sanitation facilities and higher financing gaps. According to the World Health Organization/UNICEF Joint Monitoring Programme for Water Supply and Sanitation estimates, 60% of people had access to improved water facilities in rural areas while 84% did in urban areas in 2012. According to the UN Water Global Analysis and Assessment of Sanitation and Drinking-Water (GLAAS) 2014 survey of 94 developing countries, only 27% of countries reported having more than three quarters of the finance needed to meet MDG drinking water targets in rural areas, compared with 35% of countries reporting the same for urban areas.
Way forward – water and sanitation in the SDG era
Mobilising additional aid resources for water and sanitation will be important in meeting Goal 6 of the SDGs (“Ensure availability and sustainable management of water and sanitation for all“) by 2030. Additionally, aid should be allocated to places and people where need is high, and domestic capacity to respond to these needs is low – with the ambition of ensuring no one is left behind.
More disaggregated data is also needed to improve targeting of resources and provide the best chance to meet the global goal of universal access to safe and affordable water by 2030. This means disaggregated data must move beyond geography and capture crucial information about people in poverty. We need a better understanding of people’s access to improved water and sanitation facilities, but also income, age, disability, gender and any other demographic factors that impact on a person’s needs.
For more information see WaterAid’s 2015 report, based on analysis by Development Initiatives: Essential element: why international aid for water, sanitation and hygiene is still a critical source of finance for many countries
Notes
[1] World Water Day is an internationally observed opportunity to learn more about water-related issues, be inspired to tell others and take action to make a difference.
[2] WHO, UNICEF and JMP define an improved drinking-water source as one that, by nature of its construction or through active intervention, is protected from outside contamination, in particular from contamination with faecal matter. ‘Improved’ sources of drinking water include: piped water into dwelling; piped water to yard/plot; public tap or standpipe; tube well or borehole; protected dug well; protected spring and rainwater.
[3] WaterAid (2015) report: Essential element: why international aid for water, sanitation and hygiene is still a critical source of finance for many countries.
[4] See [3]
[5] All aid data from the OECD DAC CRS. All figures in constant prices. By default, data refers to gross disbursements from all donors. Disbursements correspond to the release of funds or the purchase of goods or services for a recipient.
[6] The assessment was based on a word description search of all long descriptions. For “rural” support, word search included “rural”, “village” or “watershed”, and “ruraux” (plural of “rural” in French). For “urban” support, word search includes “urban”, “cities”, “city” and “town”, and “ville” and “urbain” (“city” and “urban” in French). 2,553 projects were identified out of the total 9,224 water and sanitation aid projects. These are indicative and not necessarily accurate.


Related content
Priorities for the UK’s incoming Secretary of State Alok Sharma
As Alok Sharma takes office as Secretary of State, DI's Amy Dodd sets out key priorities for the UK and its global development agenda.
From review to delivery on the Global Goals – what should the immediate priorities be for the UK government?
On 26 June, the UK government published its Voluntary National Review measuring delivery against the Global Goals - but does it accurately capture progress?
Three priorities for the High-level Political Forum 2019
DI Director of Partnerships & Engagement Carolyn Culey sets out three key priorities for closing the gap between the poorest and the rest at HLPF 2019