Total official development assistance in 2014
Organisation for Economic Co-operation and Development (OECD) Development Assistance Committee (DAC) donors reported record levels of net official development assistance (ODA) in 2014, at US$137.2 billion. This is US$2 billion higher than in the preliminary 2014 figures published in April 2015.
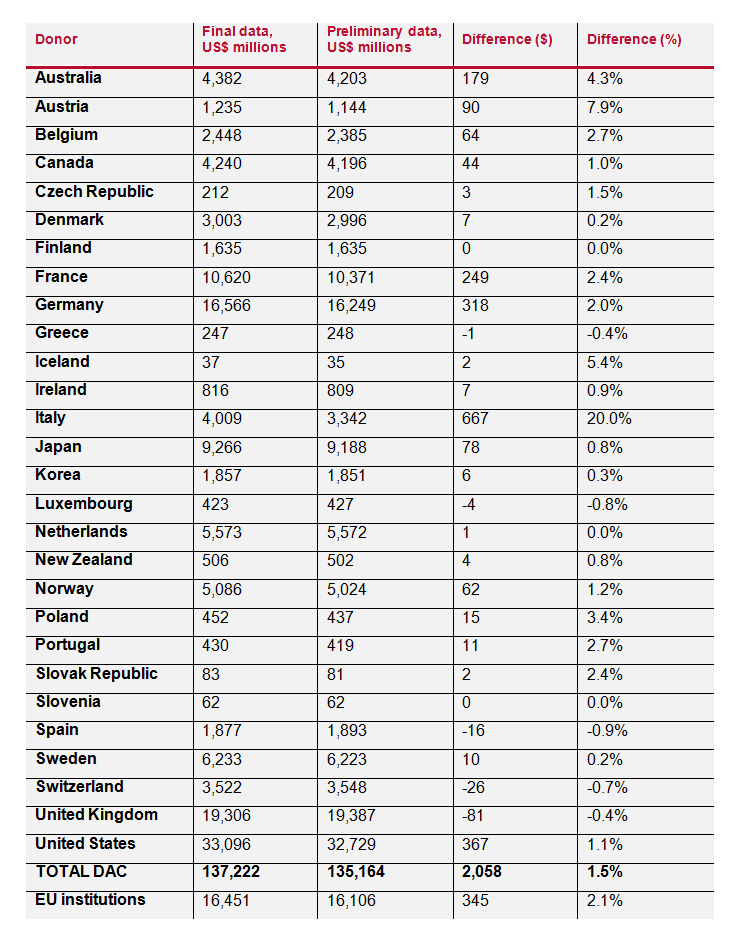
21 donors reported higher levels of ODA in the final figures and just 5 reported lower levels. Italy reported by far the biggest difference between the preliminary and final figures (up by US$667 million). The United States (+US$367 million), Germany (+US$318 million) and France (+US$249 million) also reported significant increases. The largest reduction in reported ODA came from the United Kingdom (-US$81 million) although this represented only 0.4% of UK ODA.
Regional distribution of ODA in 2014
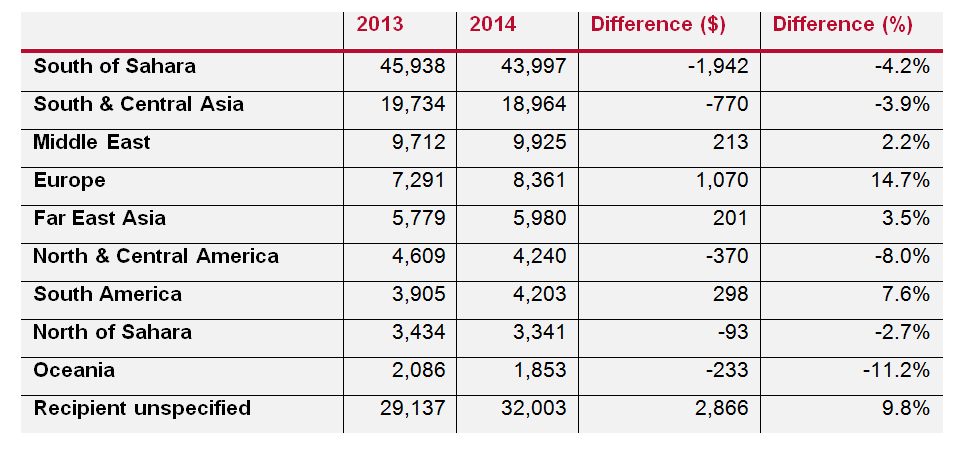
Despite the record levels of total ODA, disbursements to sub-Saharan Africa fell by over US$1.9 billion in real terms to US$44.0 billion. This is the lowest level in real terms since 2008, though is partly explained by lower levels of debt relief.
The donors reporting the greatest reductions in ODA to sub-Saharan Africa were Japan
(-US$677 million), the Global Fund (-US$584 million), African Development Bank (-US$352 million), IMF (-US$273 million) and Spain (-US$251 million). However the EU increased its disbursements to sub-Saharan by US$550 million and IDA increased its by US$231 million.
The largest increase in ODA to a specific geographic region was Europe; this was driven by a substantial rise in ODA disbursements to Turkey (due to additional loans from France, Germany and the EU) and Ukraine (large budget support grants from the EU plus additional lending from Japan and Canada).
There was also a very large rise (US$2.9 billion) in ODA without a specific geographical recipient. This totalled over US$32 billion, a rise of almost 10%. This was mainly driven by additional spending on refugees with both spending on refugees in donor countries and contributions to refugee-related special-purpose funds increasing significantly.
ODA to least developed countries in 2014
ODA to least developed countries (LDCs) declined noticeably, by US$4.2 billion to US$43.1 billion between 2013 and 2014. As a consequence, ODA to LDCs as a proportion of total ODA disbursements fell from 35% in 2013 to 31% in 2014 – the lowest share since 2006.
Figure 1: Net ODA to LDCs
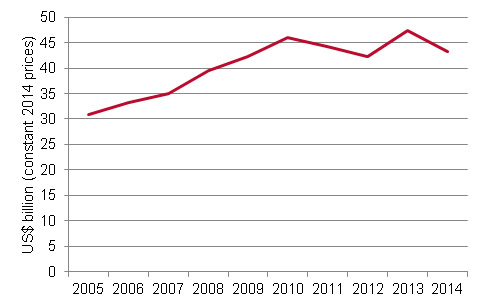
Japan reported the largest reduction (-US$3.7 billion), but this is mainly due to Japan’s 2013 figure being boosted by debt relief to Myanmar. Of the other donors, ODA to LDCs from the Global Fund declined by US$517 million, France by US$460 million and the United States by US$346 million. The EU and Germany increased their disbursements to LDCs by US$616 million and US$441 million respectively.
Top recipients of ODA in 2014
Afghanistan continues to receive the most net ODA although ODA to Afghanistan has declined each year since its peak in 2011. Several sub-Saharan Africa countries who receive large amounts of ODA saw significant falls in 2014, notably Kenya and Tanzania.
India saw a significant increase in ODA received for the second successive year after hitting a five-year low in 2012. ODA levels to Turkey also remain high, having been close to or over US$3 billion for four consecutive years.
Pakistan received the largest increase in net ODA in dollar terms at almost US$1.5 billion or over 70%. Most of this rise was due to a large increase in IDA loans.
Composition of ODA in 2014
ODA loans in 2014
Figure 2: ODA loan disbursements (gross)
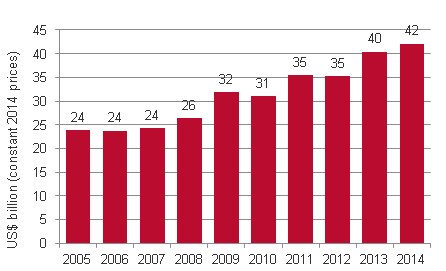
Once again the vast majority of bilateral loans from DAC donors (over 90% of new gross lending) came from just three donors: Japan, Germany and France.
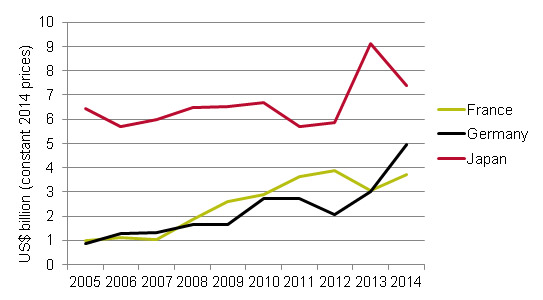
While Japan’s loans declined from their 2013 peak (Japan’s lending in 2013 was boosted by a one-off debt reorganisation deal with Myanmar), Germany and France increased lending significantly, by 64% and 22% respectively. Japan has been a major provider of ODA loans for many years and disbursing 59% of its gross ODA as loans in 2014 is not exceptional. In fact, lending has accounted for at least 50% of Japan’s ODA in five of the past six years.
In contrast France and Germany have, in recent years, massively increased the proportion of their ODA provided in the form of loans. In 2005, 10% of French and just 8% of German gross ODA was in the form of loans – by 2014 this had grown to 45% and 35% respectively. Loans from Japan are typically more concessional that those from France or Germany, with Japanese loans in 2014 having an average 78% grant element, compared with 53% for France and 44% for Germany.
Figure 3: Main bilateral providers of ODA loans
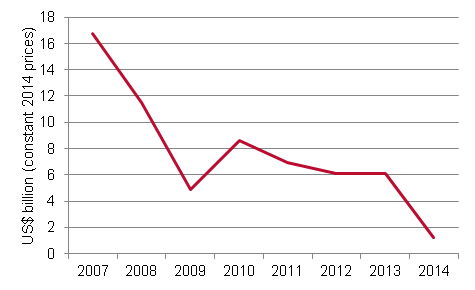
Debt relief in 2014
Debt relief declined sharply in 2014 with debt relief grants from DAC donors and multilateral agencies totalling US$1.3 billion. This contrasts with US$6.1 billion in debt relief grants recorded in both 2012 and 2013 and means that levels of debt relief hit a 25-year low in 2014.
Figure 4: Debt grant relief
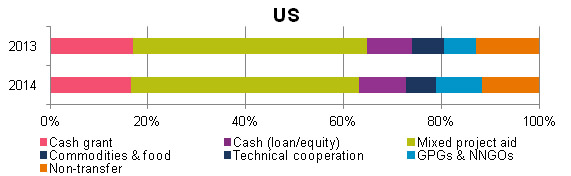
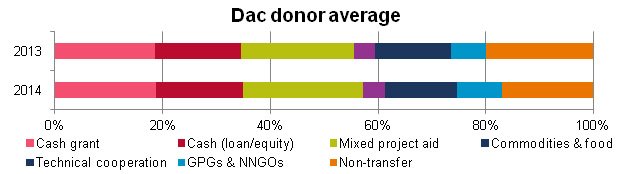
The aid bundle in 2014
The overall composition of the aid bundle changed little in 2014. The level of non-transfer aid fell from 20% of gross ODA in 2013 to 17% in 2014. This was due to the fall in debt relief, which was only partially offset by donors’ increase in refugee costs in donor countries.
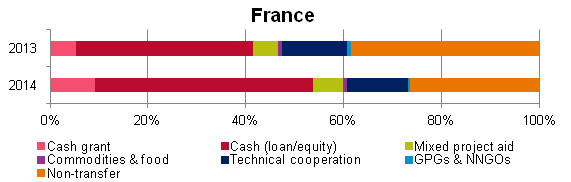
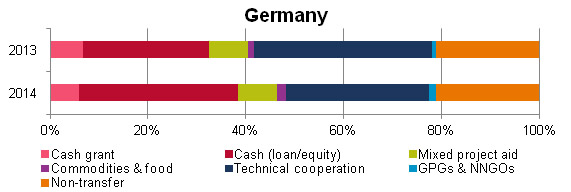
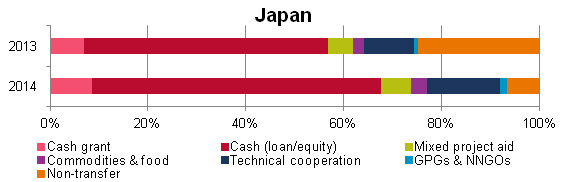
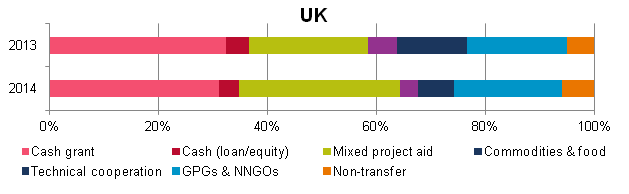
Figure 5: Aid bundles
The aid bundles of the five DAC donors providing the most ODA:
France continued to report the largest proportion of non-transfer aid – although this fell from 38% in 2013 to 26% in 2014. France gave 45% of its ODA as loans, up from 36% in 2013.
Germany also increased its proportion of loans in 2014 – to 35% from 26% in 2013. In contrast, German technical cooperation fell proportionately in 2014 – to 29% from 36%.
Japan continued its preference for ODA loans: these made up 59% of Japanese ODA in 2014 (50% in 2013). Non-transfer aid comprised only 7% of Japan’s gross ODA – down from 25% in 2013 due to exceptional debt relief to Myanmar.
The UK aid bundle was broadly similar in 2014 to in 2013 with a slight rise in mixed project aid and a fall in the proportion of aid as technical cooperation.
The US aid bundle was also very similar to 2013. The US reported the largest proportion of mixed project aid of any major donor, largely because technical cooperation is reported in a way that make it difficult to separate out in the data.