ODA to LDCs targets: what do the data tell us?
People in least developed countries (LDCs) tend to be in deeper poverty and have fewer domestic resources than other developing countries, and are vulnerable to risks, politically and environmentally.
There are, therefore, calls for additional international support for these countries in current global debates. A recent DI briefing quantified the implications of the two currently debated targets for ODA to LDCs; this data blog summarises its findings.
Why LDCs?
Remarkable development progress was seen between 1990 and 2010 as extreme poverty rates were halved. But ending poverty requires a shift of focus towards the needs of the world’s poorest people rather than countries. We have argued for an explicit focus on improving the prospects and opportunities for the poorest 20% of people globally and monitoring of their progress. This will help mobilise the resources, investments, partnerships and cooperation needed to realise the 2030 goal of ending extreme poverty.
The current country-based allocation system for official development assistance (ODA) is inadequate and needs to become more sophisticated. But until we have the sub-national data needed to accurately target the poor, LDCs – a UN-recognised group of currently 48 countries – are a readily available option for channelling resources to poorer people. LDC status is based on low income per capita and assessments of low human assets and economic vulnerability. LDCs are home to a third of people living in the poorest 20% globally, and their poverty tends to be deeper.
ODA to LDCs has increased in the last decade, but is projected to fall
Aid to LDCs has increased in recent years, reaching a high of US$48 billion in 2013. While ODA overall has almost doubled since 2000, the share of aid to LDCs increased from 28% to 31% in 2013.(1)
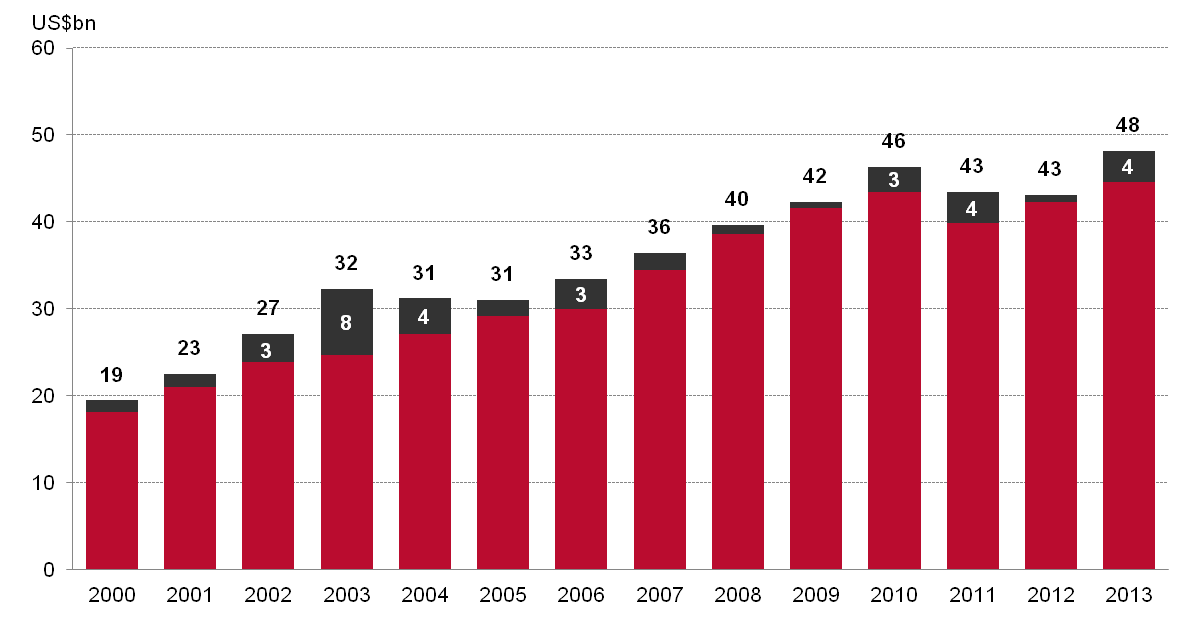
However, preliminary Organisation for Economic Co-operation and Development (OECD) data for 2014 suggests that aid levels may have fallen back since 2013.(2) Also, the limited information available on donors’ forward spending plans suggests further falls in aid to LDCs.
LDCs’ share of ODA
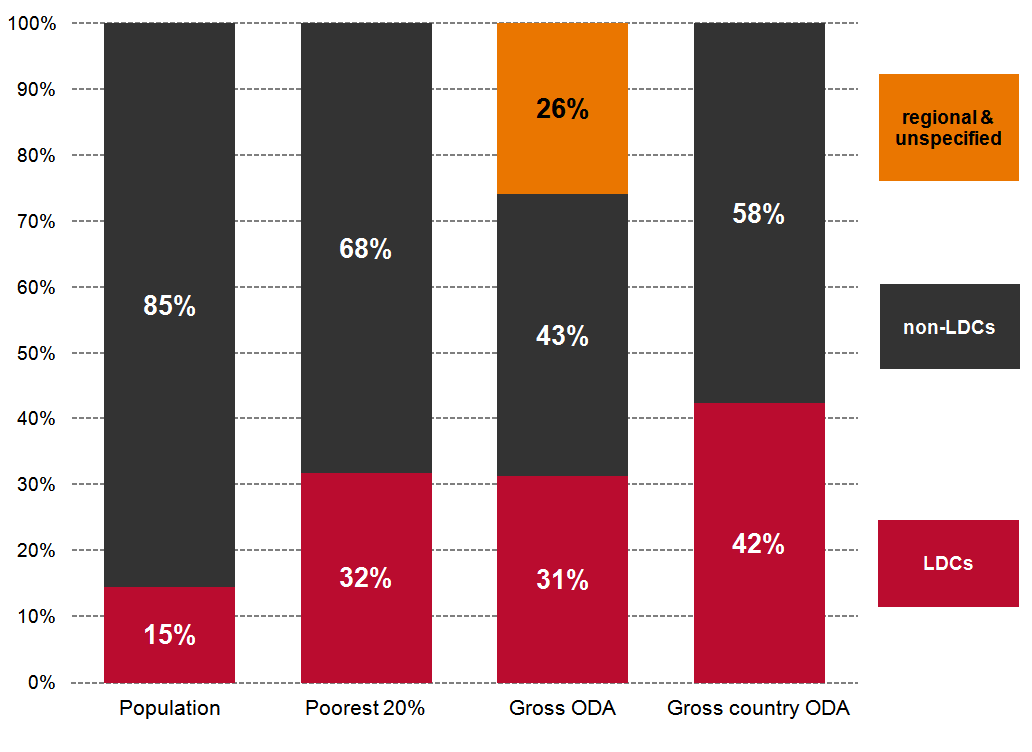
LDCs received 31% of total gross aid (‘gross’ meaning aid that does not subtract from the total ODA that flows out as loan repayments) in 2013. But this figure includes aid that cannot be said to be allocated to a particular country. Some is allocated on a regional basis and some to support global public goods, such as research into communicable diseases that will benefit all countries – including LDCs. When we examine ‘country-allocable’ aid only, which excludes this broader category of aid, we find that 42% went to LDCs in 2013.
A quarter of gross aid does not go to countries, but LDCs get 42% of that which does
Two ‘ODA-to-LDCs’ targets
Various options have been proposed for increasing ODA to LDCs. This data blog looks at two:
0.15–0.20% of GNI
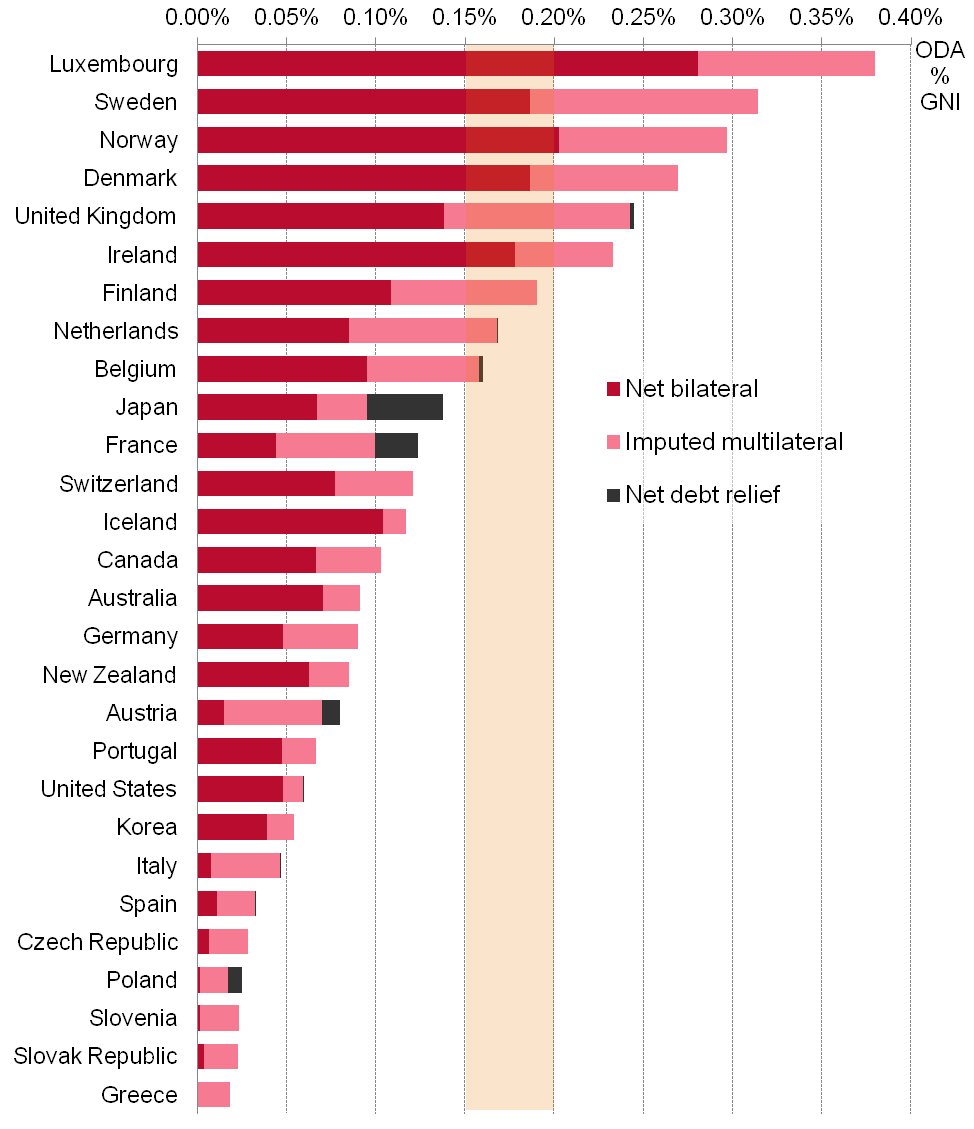
The established target, emerging from the 2011 Istanbul Programme of Action for LDCs, is that OECD Development Assistance Committee (DAC) donors should provide 0.15–0.20% of their gross national income (GNI) as ODA to LDCs.
Collectively DAC countries provided US$46 billion of net ODA to LDCs in 2013, around half of the US$91 billion needed to reach 0.20% of GNI. This represented 0.10% of their overall national income in 2013, up from 0.06% in 2000. Performance among DAC donors varies, with three donors providing 0.30% or more of their GNI and seven less than 0.05%.
Six donors have reached the 0.20% target based on net ODA, nine have reached 0.15%
50% of aid
In current UN Finance for Development negotiations LDCs and other stakeholders have been proposing that 50% of ODA should be allocated to LDCs. However, donor performance against this target would depend on whether total aid or ‘country-allocated’ aid was being measured.
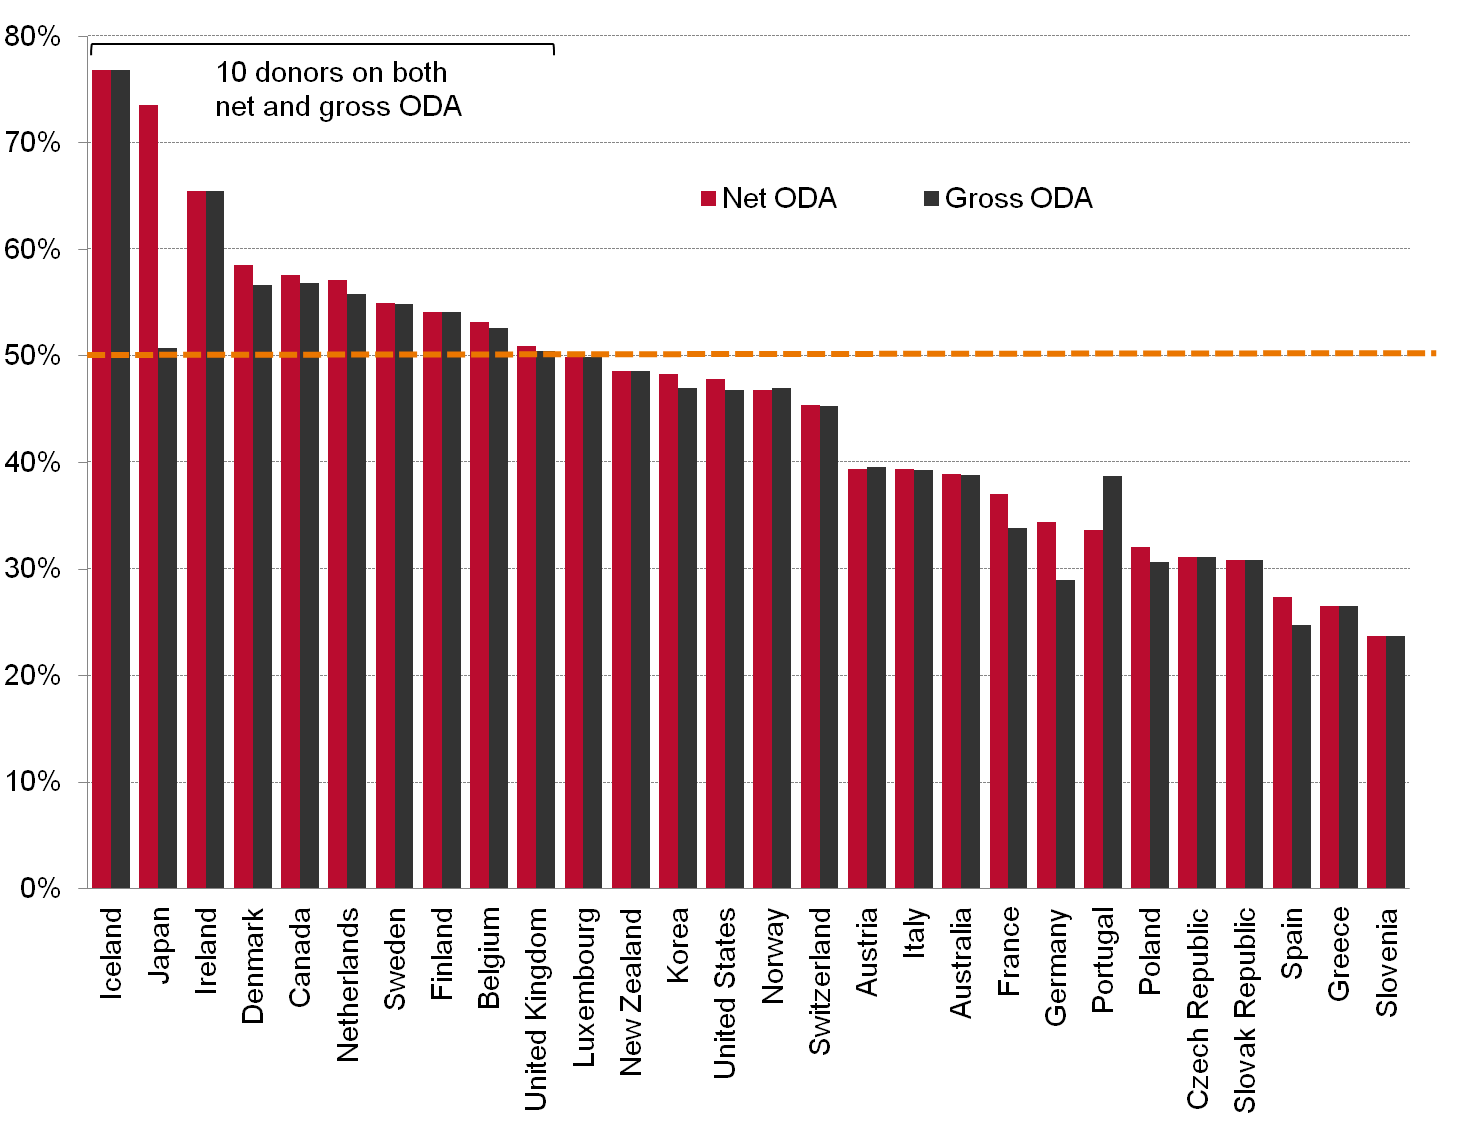
If we analyse country-allocated aid, some 10 donors meet the 50% target already, with another (Luxembourg) just below and five more donors above 40%. However, less than 30% of this type of aid from Spain, Greece and Slovenia goes to LDCs.(4) Meeting 50% of country-allocated ODA would mean a further US$5 billion would need to be provided, on top of the US$50 billion that went to LDCs in 2013.
For aid that goes only to countries, 10 donors meet the proposed 50% target
For more information see our briefing, Targeting aid to reach the poorest people: LDC aid trends and targets.
Notes
For historical data, LDC country classifications in place in each year have been used. All in US$ billions (constant 2012 prices). ‘Gross’ is that amount of ODA provided in a given year, while ‘net’ deducts repayments of past aid loans.
Methodology behind charts: The first chart shows net ODA disbursements from all donors (DAC, non-DAC and multilaterals), including and excluding debt relief. The second chart shows shares of total gross and gross county-allocated ODA disbursements from all donors (DAC, non-DAC and multilaterals) including debt relief in 2013. The third chart shows the LDC share of country-allocated net and gross bilateral and imputed multilateral ODA disbursements including debt relief for DAC-28 donor countries in 2013. The fourth chart shows net bilateral ODA, net bilateral debt relief and imputed multilateral aid disbursements for DAC-28 donor countries to countries classified as LDCs in 2013, as shares of 2013 donor GNI.
(1) Debt relief was significant in several years, amounting to US$4 billion in both 2011 and 2013. Myanmar alone received US$3 billion in debt relief in 2013.
(2) Data are currently only available for net bilateral ODA from the 28 donor countries that are OECD DAC members, compared with total aid from all donors in the first chart. DAC-28 aid to LDCs is thought to have fallen by 16% in 2014 (US$7 billion in 2013 prices), and even discounting exceptional debt relief in 2013 there was an 8% fall in aid to LDCs. This compares with a slight overall fall of 0.5% in aid to developing countries. (Source: OECD, 2014 preliminary ODA data release, 8 April 2015.)
(3) Shares of population and poorest 20% of people globally for 2011 are based on World Bank PovcalNet model coverage. Shares of total gross and gross county-allocated ODA disbursements from all donors (DAC, non-DAC and multilaterals) including debt relief in 2013.
(4) Just two DAC donors exceeded 50% on total gross ODA in 2013: Japan and Ireland.
Source
DI calculations based on OECD DAC database, table 2a. The second chart uses shares of population and poorest 20% of people globally for 2011 and are based on World Bank PovcalNet model coverage.


Related content
Priorities for the UK’s incoming Secretary of State Alok Sharma
As Alok Sharma takes office as Secretary of State, DI's Amy Dodd sets out key priorities for the UK and its global development agenda.
From review to delivery on the Global Goals – what should the immediate priorities be for the UK government?
On 26 June, the UK government published its Voluntary National Review measuring delivery against the Global Goals - but does it accurately capture progress?
Three priorities for the High-level Political Forum 2019
DI Director of Partnerships & Engagement Carolyn Culey sets out three key priorities for closing the gap between the poorest and the rest at HLPF 2019