Understanding the resource landscape
Private development assistance (PDA) is an international resource given voluntarily from private sources, and transferred across borders for international development and poverty reduction. PDA comes from non-governmental, foundations, and corporate giving. It is equivalent to approximately a third of official development assistance (ODA) and a tenth of foreign direct investment (FDI) to developing countries.
Resource flows to developing countries with PDA provider breakdown, 2011
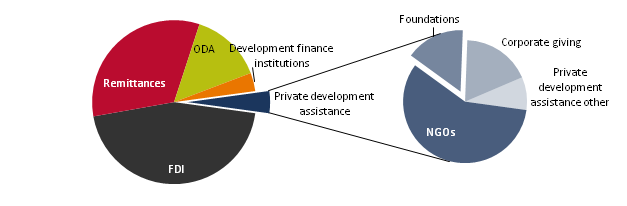
Source: Investments to End Poverty (2013)
Note: “Other” refers to PDA that cannot be allocated to a type of provider
To read more click on our key facts below or download the NGO resources for development pdf.
NGOs are the main providers of private development assistance
Of the US$45.3 billion of private development assistance to developing countries in 2011, 58% (US$26.2 billion) came from NGOs. This compares with US$7.1 billion from foundations and US$8.2 billion of corporate giving.
NGOs also delivered 17% of ODA in 2012 – but donor use of NGOs varies
In addition to the private funds, NGOs also deliver funds for official donors. The share of ODA that donors channelled through NGOs has risen from 13% of ODA in 2008 to 17% in 2012, reaching US$17 billion.
Some donors’ channel large amounts of aid through NGOs but this varies widely: NGOs provide over a quarter of several donors’ aid including Ireland, Luxembourg, Norway, Spain, Sweden and Switzerland. Some donors have set targets for ODA to be channelled through NGOs. For example, Luxembourg legislation requires at least 20% the country’s ODA to go through NGOs. The French Government has also declared that it would double the share of ODA that goes through NGOs over 2013-18.
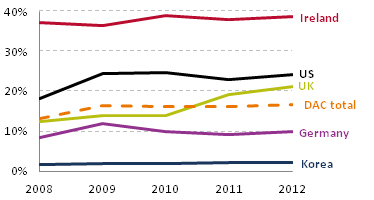
Source: OECD CRS. DAC is the Development Assistance Committee.
NGO private development assistance is highly concentrated through large, well-known organisation
Distribution of revenue to international NGOs in selected countries, various years
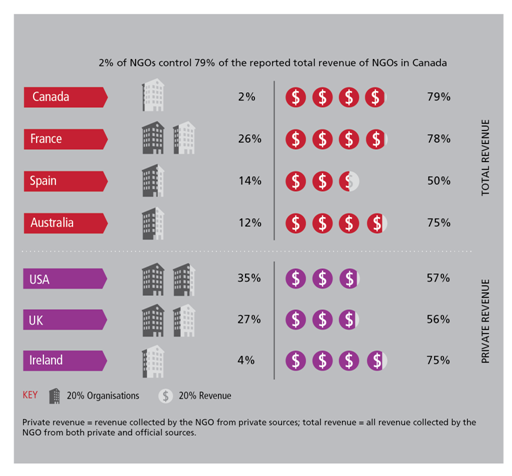
A handful of organisations receive a large share of the revenue to the international NGO sector. At the other end of the scale, PDA is fragmented among many smaller NGOs.
For example, 35 organisations in Canada received 79% of all revenue raised by non-profit organisations for international development in 2011. Over 1,000 organisations shared the remaining 21% of revenue in Canada.
Large NGOs deliver volumes of assistance comparable with some ODA donors
Some NGOs have total annual income over US$1 billion, including government and private income, and their disbursement levels are similar to those of some ODA donors.
Income of NGOs surpasses expenditure of some governments and aid donors, 2011, US$ billions
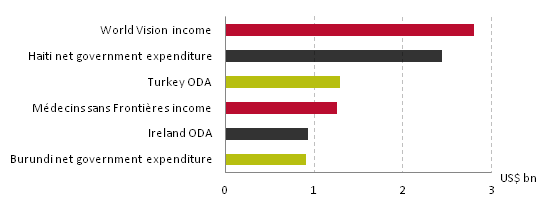
Source: NGOs’ financial reports and ITEP (2013).
Amounts raised and disbursed by NGOs increased 26% over 2006–2011
While it is challenging to measure the growth of NGO resources, national data sources show numbers of NGOs are increasing. Membership of BOND, the platform for UK NGOs working in development, grew from 344 to 360 between 2007–8 and 2010–11. In emerging economies, non-profit organisations are also multiplying: an estimated 700 national NGOs opened every day in India in 2011.
The total income of a sample of 31 NGOs increased by 26% over 2006–2011, including a 37% increase in income from PDA. These 31 NGOs are mixed group, partly selected based on the availability of financial information. This reported increase may be skewed by improved reporting on private income in NGOs’ own financial reports.
56% of NGO income came from private sources in 2011
Trends in income of 31 selected NGOs, US$ billions
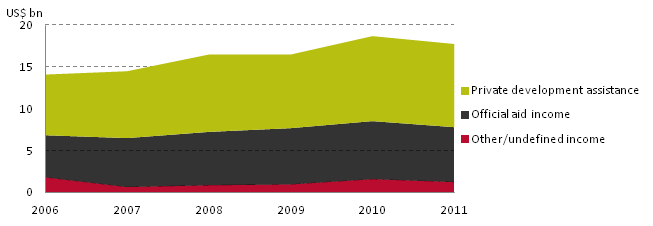
Source: NGOs’ financial reports
The share of public funds or ODA as a source of income for NGOs is falling as they diversify their funding streams, particularly towards private funding.
Individuals provide most of the private development assistance going through NGOs
Individuals provide most PDA going through NGOs, though funding from foundations is growing, along with “own source” funds: private income generated by NGOs themselves, for example through the sale of goods. However, a large share of NGOs’ private income is undefined due to lack of granular reporting by NGOs, including in-kind assistance from unspecified sources.
Trends in sources of private development assistance of 31 NGOs, US$ billions
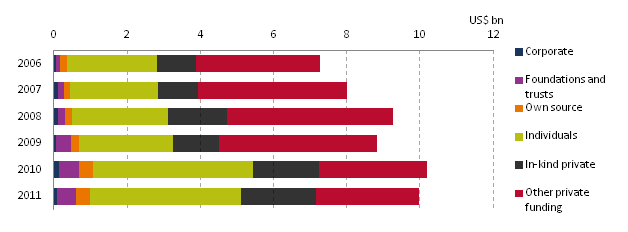
Source: NGOs’ financial reports.
NGOs tend to focus on social development
ODA going through NGOs focuses almost exclusively on social development sectors; activities related to economic infrastructure or the production sector are relatively small.
DAC ODA spending through NGOs by sector, 2012
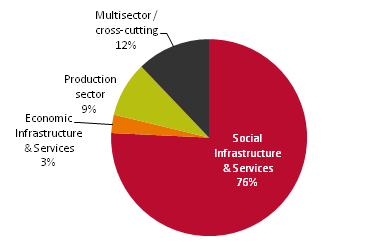
Source: OECD CRS
Many NGOs report on spending using their own unique sector classifications, or by dividing spending by beneficiary group rather than sector, making it difficult to assess the distribution of PDA across sectors.
In our sample of 31 NGOs, 16 have a strong focus on a single sector. The remaining 15 NGOs have cross-cutting approaches to delivering a variety of social services, which makes it unclear how this spending falls under different sectors.
Sector classification of 31 NGOs and breakdown of income sources by sector
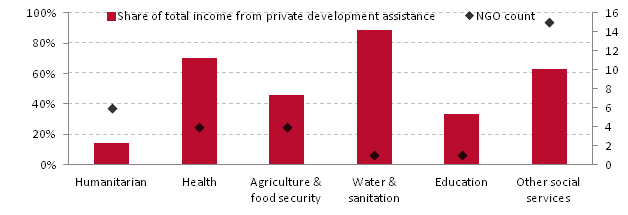
Source: 31 NGOs’ financial reports.
NGOs in the humanitarian sector appear more dependent on aid funding, while those focused on health or broadly on social services may be more successful at raising funds from private sources. However, the sample of NGOs is too limited to be representative of each sector.
NGOs’ country focus is unclear due to lack of data
From 31 NGOs, only 16 NGOs report on country-level spending in their financial reports. Better country-by-country reporting by NGOs is needed to provide a more comprehensive picture.
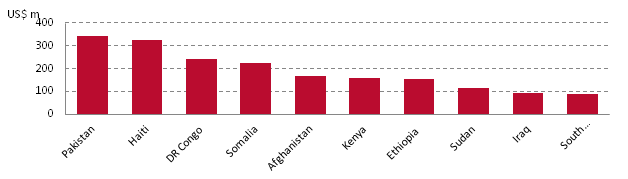
The data for these 16 NGOs reveals a strong focus on countries in a humanitarian crisis or post-crisis setting, such as Haiti. This could be in part due to better country reporting practices by humanitarian NGOs. But NGOs are also working in countries such as Kenya and Ethiopia, often on long-term development activities.
Expenditure of 16 NGOs by country, 2011, US$ millions
Source: 16 NGOs’ financial reports.


