Aid down slightly in 2014, but what else does the new DAC data tell us?
After reaching a peak in 2013, official development assistance (ODA) fell by 0.5% in real terms in 2014: Collectively, ODA from the 28 Organisation for Economic Co-operation and Development (OECD)’s Development Assistance Committee (DAC) country donors (DAC-28) totalled US$134.4 billion in 2014, compared with US$135.1 billion in 2013 (all data in constant 2013 prices).[1]
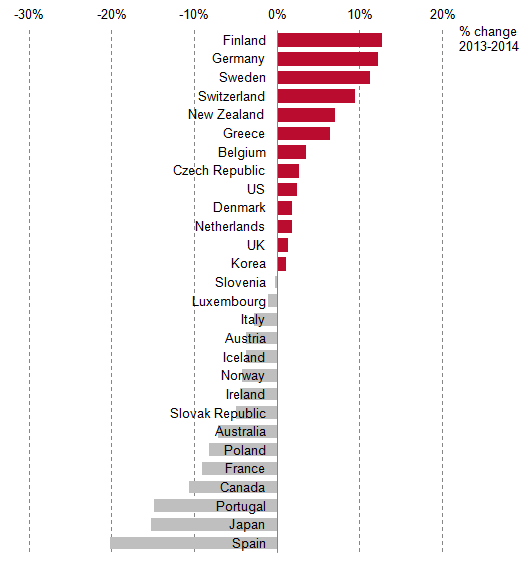
15 of the 28 DAC countries saw ODA levels fall: The largest fall was recorded by Japan, with ODA falling by US$1.8 billion. Japan’s increase in ODA in 2013 was boosted by exchange rate factors and one-off debt relief to Myanmar. France recorded a reduction of US$1 billion in 2014. This follows a similarly large fall in 2013, meaning that French ODA has declined by 18% over the last two years.
However, 13 donors recorded increased ODA: Total ODA from Germany rose by US$1.7 billion, while ODA from the US and Sweden rose by US$0.7 billion and US$0.6 billion, respectively.
Proportional changes in DAC-28 ODA, 2013–2014 (constant 2013 prices)
Five DAC donors still meet 0.7%: Sweden, Denmark, Norway, Luxembourg and the UK all maintained ODA above the UN 0.7% of gross national income (GNI) target. The UK maintained 0.7% having reached this level for the first time in 2013. By contrast, the Netherlands fell below 0.7%, having met 0.7% from 1975 until 2012.
Although most donors (18) saw ODA as a proportion of GNI fall: Norway saw the largest relative fall among DAC donors (1.07% to 0.99%), though it remains the third most generous DAC donor using this measure. Other significant falls were reported by Ireland (0.46% to 0.38%), Australia (0.33% to 0.27%) and France (0.41% to 0.36%).
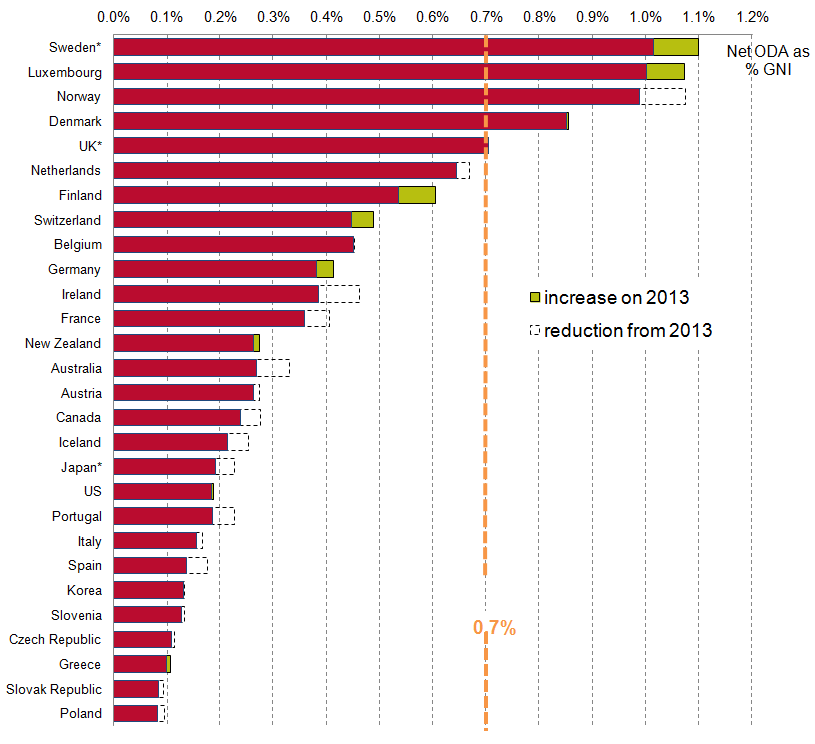
* Three donors (Japan, Sweden and UK) use SNA93/ESA95 as the basis for calculating GNI.
Most donors have changed how they calculate GNI: 25 of the DAC-28 have adopted a new international measure of GNI against which they report their ODA. This tends to lead to slight upward revisions of GNI and so corresponding falls in ODA/GNI ratios. The three donors still reporting ODA as a share of GNI on the old measure of GNI are Japan, Sweden (who reported a rise in this measure from 1.01% to 1.10%) and the UK (who reported just over 0.7% for the second year running).
Notes
[1] All US$ figures in this note are 2013 constant prices.
* Three donors (Japan, Sweden and UK) use SNA93/ESA95 as the basis for calculating GNI.
Source
OECD, DAC 2014 provisional data release, 8 April 2015, advance 2014 spreadsheet and DAC database, table 1


Related content
Priorities for the UK’s incoming Secretary of State Alok Sharma
As Alok Sharma takes office as Secretary of State, DI's Amy Dodd sets out key priorities for the UK and its global development agenda.
From review to delivery on the Global Goals – what should the immediate priorities be for the UK government?
On 26 June, the UK government published its Voluntary National Review measuring delivery against the Global Goals - but does it accurately capture progress?
Three priorities for the High-level Political Forum 2019
DI Director of Partnerships & Engagement Carolyn Culey sets out three key priorities for closing the gap between the poorest and the rest at HLPF 2019